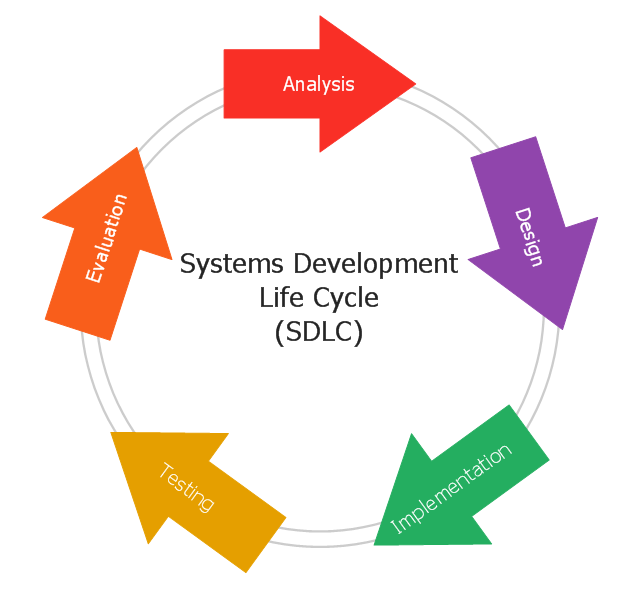
This circular arrows diagram sample shows the systems development life cycle (SDLC) stages.
"The systems development life cycle (SDLC), also referred to as the application development life-cycle, is a term used in systems engineering, information systems and software engineering to describe a process for planning, creating, testing, and deploying an information system. The systems development life-cycle concept applies to a range of hardware and software configurations, as a system can be composed of hardware only, software only, or a combination of both." [Systems development life-cycle. Wikipedia]
The arrow circle diagram example "Systems development life cycle" was created using the ConceptDraw PRO diagramming and vector drawing software extended with the Circular Arrows Diagrams solution from the area "What is a Diagram" of ConceptDraw Solution Park.
Circular arrows diagram

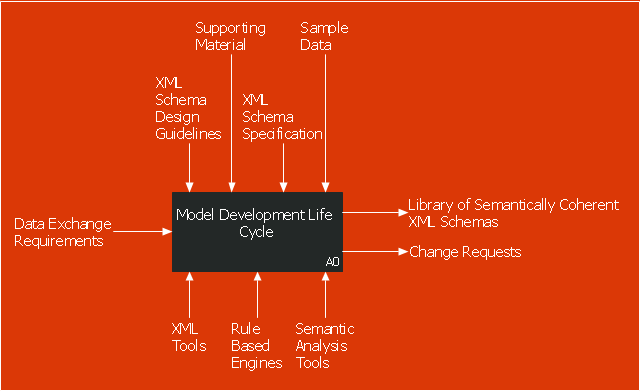
This IDEF0 diagram sample was created on the base of the figure from the website of the Engineering Laboratory of the National Institute of Standards and Technology (NIST). [mel.nist.gov/ msidlibrary/ doc/ kc_ morris/ gsa-final_ files/ image002.gif]
"The systems development life cycle (SDLC), also referred to as the application development life-cycle, is a term used in systems engineering, information systems and software engineering to describe a process for planning, creating, testing, and deploying an information system. The systems development life-cycle concept applies to a range of hardware and software configurations, as a system can be composed of hardware only, software only, or a combination of both." [Systems development life cycle. Wikipedia]
The IDEF0 diagram example "Model development life cycle" was created using the ConceptDraw PRO diagramming and vector drawing software extended with the IDEF0 Diagrams solution from the Software Development area of ConceptDraw Solution Park.
IDEF0 diagram
SSADM Diagram

This circular arrows diagram sample shows the systems development life cycle (SDLC) stages.
"The systems development life cycle (SDLC), also referred to as the application development life-cycle, is a term used in systems engineering, information systems and software engineering to describe a process for planning, creating, testing, and deploying an information system. The systems development life-cycle concept applies to a range of hardware and software configurations, as a system can be composed of hardware only, software only, or a combination of both." [Systems development life-cycle. Wikipedia]
The arrow circle diagram example "Systems development life cycle" was created using the ConceptDraw DIAGRAM diagramming and vector drawing software extended with Business Diagrams solution from Management area of ConceptDraw Solution Park.
Circular arrows diagram
Circular Flow Diagram Template

 Business Diagrams
The Business Diagrams Solution extends ConceptDraw DIAGRAM with an extensive collection of professionally designed illustrative samples and a wide variety of vector stencils libraries, which are the real help for all business-related people, business analysts, business managers, business advisers, marketing experts, PR managers, knowledge workers, scientists, and other stakeholders allowing them to design the bright, neat, expressive and attractive Bubble Diagrams, Circle-Spoke Diagrams, Circular Arrows Diagrams, and Venn Diagrams with different quantity of sets in just minutes; and then successfully use them in documents, reports, statistical summaries, and presentations of any style.
UML Diagram Visio

 Block Diagrams
Block diagrams solution extends ConceptDraw DIAGRAM software with templates, samples and libraries of vector stencils for drawing the block diagrams.
This arrow loop cycle diagram sample was created on the base of the figure illustrating the webpage "Exploratory Advanced Research Program Hand-Off Workshops" from the US Department of Transportation - Federal Highway Administration (FHWA) website. "The FHWA’s research and technology innovation life cycle illustrates that research and technology development are not insular activities, but integrated processes that together constitute a system.
Following general workshop discussion, a number of common issues emerged among the groups. These centered around the research life cycle, communicating the value of exploratory advanced research, and continued project funding. It was felt that there is a general need to better describe the research and deployment cycle specific to highway transportation and possibly to highway research fields, such as materials or system planning. Research life cycle diagrams show a very linear, chronological process but it is not necessarily that way in reality." [fhwa.dot.gov/ advancedresearch/ pubs/ 11034/ ]
The arrow loop diagram example "Innovation life cycle" was created using the ConceptDraw PRO diagramming and vector drawing software extended with the Target and Circular Diagrams solution from the Marketing area of ConceptDraw Solution Park.
www.conceptdraw.com/ solution-park/ marketing-target-and-circular-diagrams
Arrow loop cycle diagram
Data Flow Diagram Symbols. DFD Library

JSD - Jackson system development

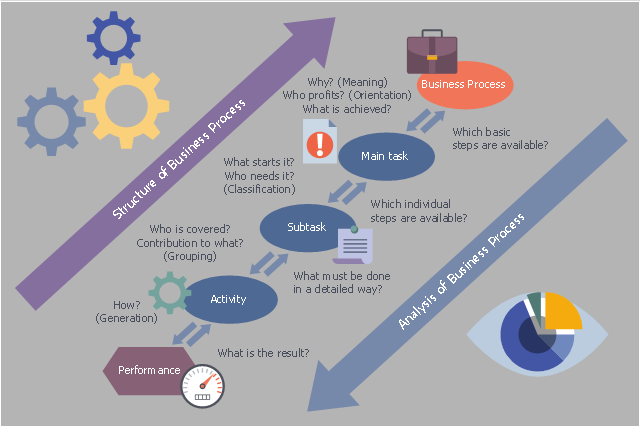
This workflow diagram example was designed on the base of the figure "Structure and Analysis of Business Processes" in the webpage "Lifecycle Process Model "V-Model. ... Connection between Business Process Reengineering and V-Model" on the website of the Computer Science, Faculty 3, Bremen University. [informatik.uni-bremen.de/ gdpa/ part3/ p3gpo.htm]
"The V-model is a term applied to a range of models, from a conceptual model designed to produce a simplified understanding of the complexity associated with systems development to detailed, rigorous development lifecycle models and project management models.
There are several radically different forms of the V-model, and this creates considerable confusion. The V-model falls into three broad categories.
Firstly there is the German V-Model "Das V-Modell", the official project management methodology of the German government. It is roughly equivalent to PRINCE2, but more directly relevant to software development. The key attribute of using a "V" representation was to require proof that the products from the left-side of the V were acceptable by the appropriate test and integration organization implementing the right-side of the V." [V-Model. Wikipedia]
The workflow diagram example "Business Processes Structure and Analysis" was created using ConceptDraw PRO software extended with the Business Process Workflow Diagrams solution from the Business Processes area of ConceptDraw Solution Park.
Workflow diagram
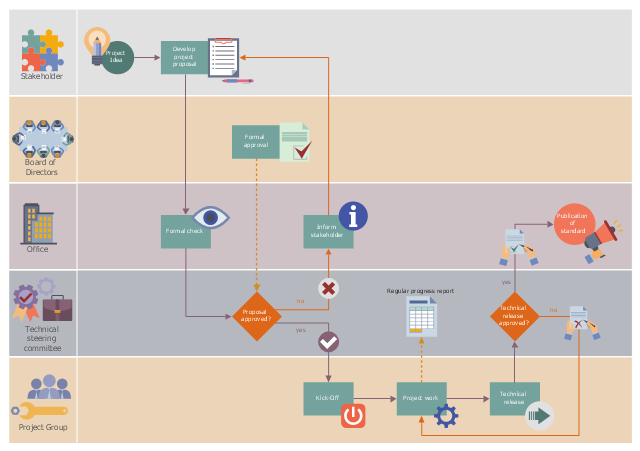
This workflow diagram example was designed on the base of the Wikimedia Commons file: ASAM e.V. flowchart.png.
"Life cycle of an ASAM standard." [commons.wikimedia.org/ wiki/ File:ASAM_ e.V._ flowchart.png]
This file is licensed under the Creative Commons Attribution-Share Alike 3.0 Unported license. [creativecommons.org/ licenses/ by-sa/ 3.0/ deed.en]
"Association for Standardization of Automation and Measuring Systems or ASAM is an incorporated association under German law. Its members are primarily international car manufacturers, suppliers and engineering service providers from the automotive industry. The association coordinates the development of technical standards, which are developed by working groups composed of experts from its member companies. ASAM pursues the vision that the tools of a development process chain can be freely interconnected and allow a seamless exchange of data. The standards define protocols, data models, file formats and application programming interfaces (APIs) for the use in the development and testing of automotive electronic control units." [Association for Standardisation of Automation and Measuring Systems. Wikipedia]
The workflow diagram example "Life cycle of an ASAM standard" was created using ConceptDraw PRO software extended with the Business Process Workflow Diagrams solution from the Business Processes area of ConceptDraw Solution Park.
Workflow diagram
Jackson Systems

Entity Relationship Diagram Software Engineering

UML Collaboration Diagram (UML2.0)
 *")

SDL Diagram

UML Class Diagram Example for Transport System

 IDEF0 Diagrams
IDEF0 Diagrams visualize system models using the Integration Definition for Function Modeling (IDEF) methodology. Use them for analysis, development and integration of information and software systems, and business process modelling.
System Design

- Draw A Sketch Of System Development Cycle
- Systems development life cycle | SSADM Diagram | Process ...
- Systems development life cycle | SSADM Diagram | Circular Flow ...
- Systems development life cycle | DFD - Process of account ...
- Systems development life cycle | Block Diagrams | Circular Arrows ...
- Systems development life cycle | Draw Diagram Of Information ...
- Systems development life cycle | Circular Arrows Diagrams | Block ...
- Model development life cycle - IDEF0 diagram | Circular Arrows ...
- Systems development life cycle | Circular Arrows Diagrams | Circular ...
- Systems development life cycle | Explain System Development ...
- Process Flowchart | Systems development life cycle | JSD - Jackson ...
- Systems development life cycle | Innovation life cycle - Arrow loop ...
- Data Flow Diagram Example In Sdlc Phases
- Systems development life cycle | Circular Flow Diagram Template ...
- BPM life cycle | Systems development life cycle | Innovation life cycle ...
- Systems development life cycle
- Circular arrows diagram - PDCA cycle | BPM life cycle | Systems ...
- BPR Diagram . Business Process Reengineering Example | Model ...
- Product life cycle graph | Push Notification Lifecycle Overview ...
- JSD - Jackson system development | Agile Methodology | ER ...