Jackson Systems
Any software development process in software engineering can be described as the one that divides software development work into separate phases in order to improve product management, project management and design. A software development process may be also known to be called as a “software development life cycle”. The most modern development processes can be described as agile ones. Other methodologies may include prototyping, waterfall, incremental and iterative as well as spiral development, extreme programming and rapid application development.
Some people think of a life-cycle "model" as of a general term for methodologies. A software development process may be considered to be a more specific term to refer to some specific process that may be chosen by a definite organization.
Jackson system development (JSD) is one of the most popular linear software development methodologies that was developed by Michael A. Jackson in the 1980s. It is based on three main principles of operation. First of all, the development must start with modeling and describing the real world. A system that is made by using Jackson system development method performs the simulation of the real world before any direct attention is paid. And it may be paid to either a purpose or a function of the system.
An appropriate model of a time-ordered world must be time-ordered itself. The main aim is to map progress in the real world on that progress that takes place in the system that models it. The way of implementing the system may be based on the transformation of specification into some particular set of processes as long as they are efficient enough. The mentioned processes should be designed in a particular manner making it possible to run them on any available hardware as well as software.
Example 1. Jackson System
When it was originally presented in 1982 by Jackson, this system development method consisted of six steps which included the entity/action, the initial model, the interactive function, the information function, the system timing and system implementation ones. Later, some steps were combined for creating a method that has only three steps. Those steps included modeling stage (analysis), network stage (design) and implementation stage (realization).
In the first, the modeling stage, the designer is expected to create the entity structure diagrams and to identify the entities in the system as well as the actions they perform and their time-ordering in the life of the entities. The attributes of the entities and actions have to be identified as well. All the entity structure diagrams are known to be using the diagramming notation of Jackson Structured Programming structure diagrams. The main purpose of such diagrams is to create a full description of all the aspects of the organization and the system. Developers have to make a choice of which things are important enough to keep and which are not. This stage can be described as the combination of the entity structures and the former entity/action steps. At the network stage, any model of the system can be developed and then represented as a system specification diagram which may be also known to be called as a network diagram. Network diagrams can be created in order to show processes in a way of a rectangle for each of them. Also, the way such processes communicate with each other may be described: either via state vector connections with the help of diamonds or via data-stream connections represented in a way of circles. At this particular stage, the functionality of the system can be defined. Each of the entities may become either a program or a process in the network diagram. All the external programs can be added to the network diagrams later. The main purpose of such programs is to calculate output, to keep the entity processes up-to-date and to process input. The system as a whole may be described with these network diagrams. They are known to be completed mentioning the descriptions of the data as well as the connections between the programs and the processes. The initial model step is the one that specifies a simulation of the real world. The function one is known to be adding the further executable processes and operations to this simulation. Such processes may be needed in order to produce an output of the system. System timing step provides synchronization among all the processes, introducing the constraints. This particular stage is simply the combination of the former “initial model” step, the “system timing” step as well as the “function” one. The abstract network model of the solution in the implementation stage is converted into a physical system. Such system may be represented as a system implementation diagram which shows the system as a scheduler process. Such representation includes mentioning the system as the one that calls modules which implement the processes. Data-streams may be represented as calls to some inverted processes and database symbols may represent the collections of the entity state-vectors where the special symbols for file buffers are. The main concern of implementation step is optimization of the system itself. It is important to reduce the number of the processes as it may be impossible to provide each of them which is contained in the specification with its own virtual processor. All the processes are known to be combined for limiting their number to the number of processors. Diagram Elements")
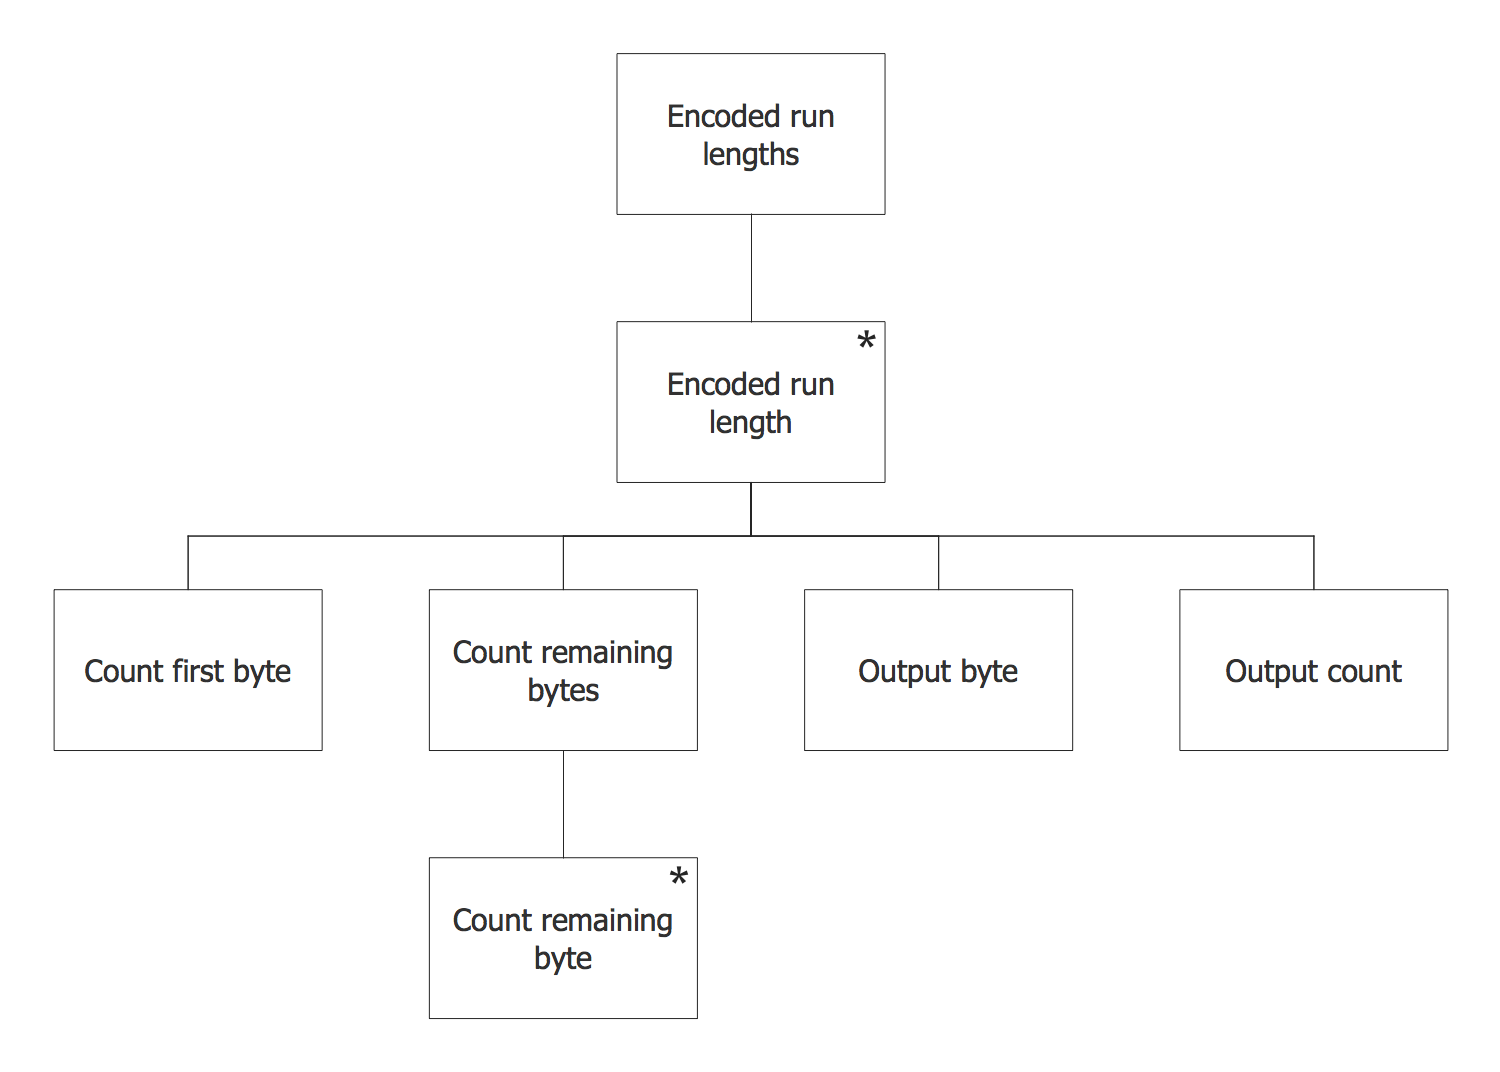
Example 2. Jackson System Elements
Entity structure diagram (ESD) notations may be created in the ConceptDraw DIAGRAM same as any other diagram, including a Jackson Structured Programming (JSP) Diagram. Having the Jackson Structured Programming (JSP) Diagrams solution may simplify the work of drawing the needed illustration representing the given data within only a few minutes. Having the pre-made examples of the JSP diagrams, any ConceptDraw DIAGRAM user is able to make his own unique as well as smart looking drawing in a fun and entertaining way.


