"As a discipline, task management embraces several key activities. Various conceptual breakdowns exist, and these, at a high-level, always include creative, functional, project, performance and service activities.
Creative activities pertain to task creation. In context, these should allow for task planning, brainstorming, creation, elaboration, clarification, organization, reduction, targeting and preliminary prioritization.
Functional activities pertain to personnel, sales, quality or other management areas, for the ultimate purpose of ensuring production of final goods and services for delivery to customers. In context these should allow for planning, reporting, tracking, prioritizing, configuring, delegating, and managing of tasks.
Project activities pertain to planning and time and costs reporting. These can encompass multiple functional activities but are always greater and more purposeful than the sum of its parts. In context project activities should allow for project task breakdown, task allocation, inventory across projects, and concurrent access to task databases.
Service activities pertain to client and internal company services provision, including customer relationship management and knowledge management. In context these should allow for file attachment and links to tasks, document management, access rights management, inventory of client & employee records, orders & calls management, and annotating tasks.
Performance activities pertain to tracking performance and fulfillment of assigned tasks. In context these should allow for tracking by time, cost control, stakeholders and priority; charts, exportable reports, status updates, deadline adjustments, and activity logging.
Report activities pertain to the presentation of information regarding the other five activities listed, including graphical display." [Task management. Wikipedia]
The example "Project tasks dashboard" was created using the ConceptDraw PRO diagramming and vector drawing software extended with the Status Dashboard solution from the area "What is a Dashboard" of ConceptDraw Solution Park.
Project tasks dashboard

HelpDesk
How to Import Project Data From MS Excel File

Gantt Chart Software

HelpDesk
What Information to be Displayed in the ConceptDraw PROJECT Gantt Chart View


How to Create Gantt Chart

 Status Dashboard
Status dashboard solution extends ConceptDraw PRO software with templates, samples and vector stencils libraries with graphic indicators for drawing the visual dashboards showing status data.
HelpDesk
What Information can be Displayed in the Multiproject Dashboard View

How to Create Presentation of Your Project Gantt Chart

HelpDesk
How to Export Project Data to MS Excel Worksheet

HelpDesk
How to Create a Gantt Chart for Your Project

HelpDesk
How to Plan and Allocate Resources in Your Project on Mac

ConceptDraw MINDMAP: Brainstorming, Mind Mapping for macOS and Windows

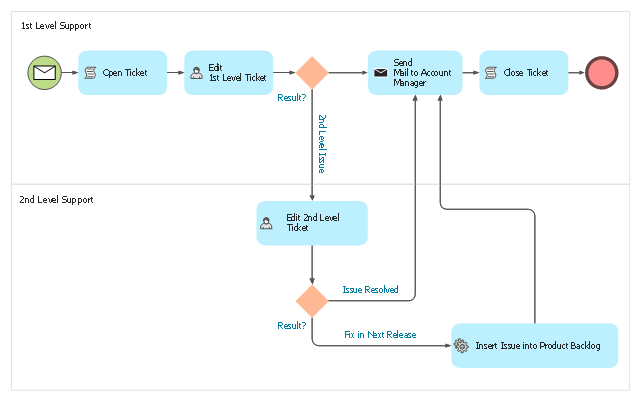
This BPMN (Business Process Model and Notation) diagram sample illustrates the issue tracking system workflow.
"An issue tracking system (also ITS, trouble ticket system, support ticket, request management or incident ticket system) is a computer software package that manages and maintains lists of issues, as needed by an organization. Issue tracking systems are commonly used in an organization's customer support call center to create, update, and resolve reported customer issues, or even issues reported by that organization's other employees. An issue tracking system often also contains a knowledge base containing information on each customer, resolutions to common problems, and other such data. An issue tracking system is similar to a "bugtracker", and often, a software company will sell both, and some bugtrackers are capable of being used as an issue tracking system, and vice versa. Consistent use of an issue or bug tracking system is considered one of the "hallmarks of a good software team".
A ticket element, within an issue tracking system, is a running report on a particular problem, its status, and other relevant data. They are commonly created in a help desk or call center environment and almost always have a unique reference number, also known as a case, issue or call log number which is used to allow the user or help staff to quickly locate, add to or communicate the status of the user's issue or request.
These tickets are so called because of their origin as small cards within a traditional wall mounted work planning system when this kind of support started. Operators or staff receiving a call or query from a user would fill out a small card with the user's details and a brief summary of the request and place it into a position (usually the last) in a column of pending slots for an appropriate engineer, so determining the staff member who would deal with the query and the priority of the request." [Issue tracking system. Wikipedia]
The business process modeling diagram example "Trouble ticket system - BPMN 2.0 diagram" was designed using the ConceptDraw PRO diagramming and vector drawing software extended with the Business Process Diagram solution from the Business Processes area of ConceptDraw Solution Park.
Business process modeling
HelpDesk
Embedded Filtering Capabilities in ConceptDraw PROJECT for Macintosh

Basic Flowchart Symbols and Meaning


- Status Dashboard | How to Report on Multiple Projects Status ...
- How to Report on Multiple Projects Status | Project management ...
- How To Create Project Report | Business Intelligence Dashboard ...
- Status Dashboard | PM Dashboards | Comparison Dashboard | Free ...
- Project management task status dashboard | Project task status ...
- Status Dashboard | How To Hold Project Collaboration via Skype ...
- Project task status dashboard - Template | Status Dashboard | How ...
- Status Dashboard | PM Dashboards | Project task status dashboard ...
- Project task status dashboard - Template | Project management task ...
- Project management task status dashboard | How to Track Your ...
- Project task status dashboard - Template | Status Dashboard ...
- Project task status dashboard - Template | Status Dashboard | How ...
- Status Dashboard | Project management task status dashboard ...
- PM Dashboards | How To Create Project Report | Project ...
- Project task status dashboard - Template | Project tasks dashboard ...
- How To Create Project Report | Project management task status ...
- Project tasks dashboard | Project task status dashboard - Template ...
- Status Dashboard | Project task status dashboard - Template ...
- How to Create Presentation of Your Project Gantt Chart | Status ...
- Project management task status dashboard