This site uses cookies. By continuing to browse the ConceptDraw site you are agreeing to our Use of Site Cookies.
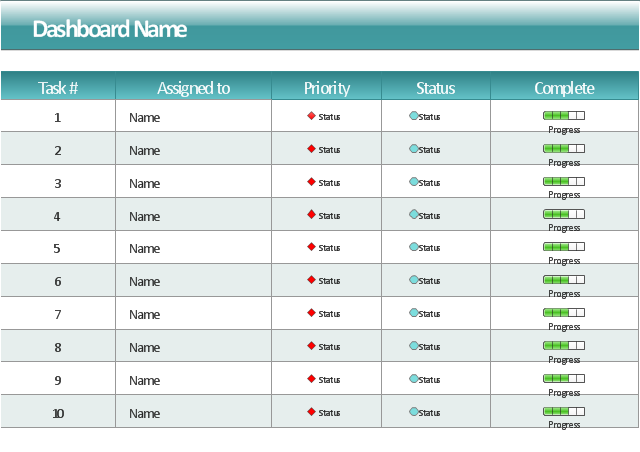
This project task status dashboard template display the task table consisting of the columns for task number, assignment (responsible person name), priority, status and complete. The task priority and status are indicated with alert visual indicators. The task complete is showed by progress indicators.
The template "Project task status dashboard" for the ConceptDraw PRO diagramming and vector drawing software is included in the Status Dashboard solution from the area "What is a Dashboard" of ConceptDraw Solution Park.
Project task status dashboard template
Project task status dashboard template, shapes alert indicator, progress indicator, progress bar, 5-state alert,

status dashboard, status indicators Status Dashboard

status dashboard, status indicators
Status dashboard solution extends ConceptDraw PRO software with templates, samples and vector stencils libraries with graphic indicators for drawing the visual dashboards showing status data.

Empower Your Sales Team With a Sales Dashboard

ConceptDraw Sales Dashboard solution allows you empower your sales team with a sales dashboard that visualizes all team and personal KPI your team need to work effectively.

Gantt Chart Templates

Gantt Chart Templates - PM Easy Solution from the Project Management Area extends ConceptDraw PROJECT with the ability to quickly start a project. It lists task dependencies and relationships making the terative planning easy.
ConceptDraw PROJECT lets you the useful possibility to create visual project dashboards and diagrams, generate various kinds of reports with one click. It provides also extensive capabilities of importing and exporting in various formats: Microsoft Project, ConceptDraw MINDMAP, Mindjet MindManager, PDF file.
HelpDesk

How to Track Your Project Plan vs. the Actual Project Condition

Conceptdraw PROJECT allows to follow how the project is going. You can easily compare the actual project data with the planned ones. The best tool for effective tracking of the project execution is to compoare real data with project baseline. It consists from the baseline start, baseline finish and baseline cost. Along with Baseline tracking ConceptDraw PROJECT offers several types of visual reports that can help to assess visually the difference between planned and actual project data.

Dashboard

ConceptDraw PRO extended with Sales Dashboard solution from the Marketing area of ConceptDraw Solution Park is a perfect software for creating the live dashboard for the business data and progress visualization.

Gant Chart in Project Management

Gant Chart is a graphical representation of tasks as segments on a time scale. It helps plan and monitor project development or resource allocation. The horizontal axis is a time scale, expressed either in absolute or relative time.
what is software project management

Sales Dashboard Template

ConceptDraw PRO software extended with the Sales Dashboard solution delivers a complete set of samples, templates and pre-designed objects you need for visualizing sales data.

Sales Dashboard Solutions can help your sales team keep an eye on performance

ConceptDraw Sales Dashboard Solution is a simple and effective way of visualizing sales data and get clear picture of your sales process to see how your business can improve.

How to Create Presentation of Your Project Gantt Chart

During the planning, discussing and execution of a project you may need to prepare a presentation using project views such as the Gantt Chart, Multiproject Dashboard or Resource Usage View. It’s easy do with ConceptDraw PROJECT!

Sales Dashboard - insight about potential opportunities and key sales operations

ConceptDraw Sales Dashboard gives you a clear insight about potential opportunities and key sales operations. Analysing sales KPI is a proven way to see how your business can improve.

Gantt Chart Software

The Gantt Chart is the main interface in ConceptDraw PROJECT. It summarizes the tasks in your project and presents them graphically so you can easily view your progress.

Gantt chart examples

All Gantt charts were made using ConceptDraw PROJECT. ConceptDraw PROJECT works both on Windows and Mac OS X. It allows to schedule a voluntary number of projects in a single Workspace document and lets easily share tasks and resources among them. ConceptDraw PROJECT shares files among Windows and Mac OS X.

ConceptDraw PROJECT is an effective tool for new and experienced users with a fine balance of usability and powerful functionality.

Gantt Chart Software

ConceptDraw PROJECT is a powerful Gantt Chart Software. The Gantt Charts are useful for displaying a large amount of detailed information, project tasks and timelines in a visually pleasing, easy-to-understand format.
ConceptDraw PROJECT provides wide capabilities of importing and exporting in various formats: Microsoft Project, ConceptDraw MINDMAP, Mindjet MindManager, PDF file.