HelpDesk
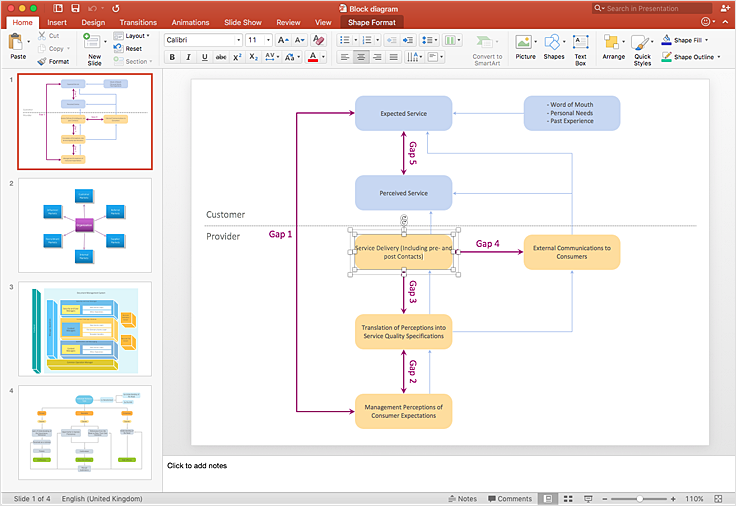
How to Add a Block Diagram to a PowerPoint Presentation
A block diagram is a useful tool both in designing new processes, and in improving existing. A block diagram is a type of chart, which is often used in presentations, because of its universality - the graphic blocks can be applied to many processes.The PowerPoint presentation of major process steps and key process participants can be very informative and helpful. Using ConceptDraw DIAGRAM , you can easily convert a block diagram to MS PowerPoint presentation.
 ConceptDraw Solution Park
ConceptDraw Solution Park collects graphic extensions, examples and learning materials
Business diagrams & Org Charts with ConceptDraw DIAGRAM
The business diagrams are in great demand, they describe the business processes, business tasks and activities which are executed to achieve specific organizational and business goals, increase productivity, reduce costs and errors. They let research and better understand the business processes. ConceptDraw DIAGRAM is a powerful professional cross-platform business graphics and business flowcharting tool which contains hundreds of built-in collections of task-specific vector stencils and templates. They will help you to visualize and structure information, create various Business flowcharts, maps and diagrams with minimal efforts, and add them to your documents and presentations to make them successful. Among them are Data flow diagrams, Organization charts, Business process workflow diagrams, Audit flowcharts, Cause and Effect diagrams, IDEF business process diagrams, Cross-functional flowcharts, PERT charts, Timeline diagrams, Calendars, Marketing diagrams, Pyramids, Target diagrams, Venn diagrams, Comparison charts, Analysis charts, Dashboards, and many more. Being a cross-platform application, ConceptDraw DIAGRAM is very secure, handy, free of bloatware and one of the best alternatives to Visio for Mac users.
 Fishbone Diagrams
The Fishbone Diagrams solution extends ConceptDraw DIAGRAM software with the ability to easily draw the Fishbone Diagrams (Ishikawa Diagrams) to clearly see the cause and effect analysis and also problem solving. The vector graphic diagrams produced using this solution can be used in whitepapers, presentations, datasheets, posters, and published technical material.
- Structure Chart Diagram For Online Shopping
- Online Shopping Company Structure Chart
- Online Shopping Information In Dfd Structure
- UML Component Diagram Example - Online Shopping | UML ...
- UML Component Diagram Example - Online Shopping | UML Class ...
- Software Diagrams | Data structure diagram with ConceptDraw PRO ...
- All Diagram For Online Shoppig Pdf
- Example of DFD for Online Store (Data Flow Diagram ) DFD ...
- UML Component Diagram Example - Online Shopping | UML ...
- UML Component Diagram Example - Online Shopping | Online ...
- State Diagram For Online Shopping Sydtem
- Online Diagram Tool | UML Component Diagram Example - Online ...
- UML Diagram Types List | UML Sample Project | Data structure ...
- Sample Data Flow Diagram For Online Shop
- Online Diagram Tool | UML Component Diagram Example - Online ...
- UML Component Diagram Example - Online Shopping | UML Tool ...
- State Diagram Example - Online Store
- UML interaction overview diagram - Online shopping | How to create ...
- Collaboration Diagram For Online Shopping In Uml
- Component Diagram Example Ppt

