Process Flowchart


Types of Flowchart - Overview


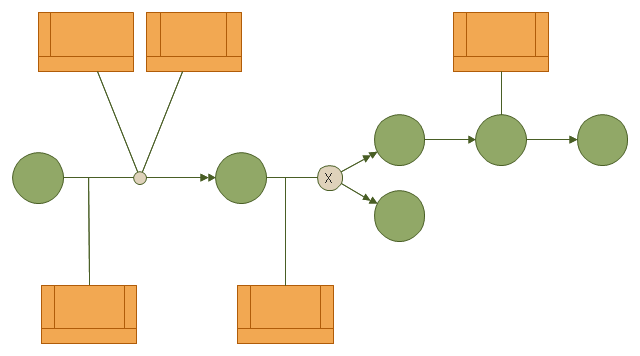
This IDEF3 diagram example was redesigned from the Wikimedia Commons file: 6-4 Example IDEF3 Object State Transition Schematic.jpg.
[commons.wikimedia.org/ wiki/ File:6-4_ Example_ IDEF3_ Object_ State_ Transition_ Schematic.jpg]
"Quick Reading of IDEF3 Process Descriptions: An Example.
An example approach for reading a schematic is described in the following steps. This outline for reading a schematic would be repeated, with few modifications, for all decompositions, whether found in a Process Schematic or an Object Schematic. In general, decompositions are read after the parent schematic has been read and understood.
The Big Picture.
A crucial step in the description-reading process is to understand the big picture
relevant to the real-life situation described. This big picture can be gained by reading and understanding the statement of purpose, statement of scope, objective of the scenario being described, and viewpoint of the IDEF3 Process Description. ...
Scan the Schematic.
Readers should become familiar with the scenario by scanning the schematic from left to right. This involves becoming familiar with the individual elements (e.g., UOBs, links, and junctions) displayed in the schematic. This is not an in-depth study of the schematic; rather, it provides readers with a general impression of the process being described and an overall understanding of the logic flow in the scenario.
Understand the Description.
In this step, readers gain a detailed understanding of the schematic associated with a scenario, object, or a decomposition of a schematic element. This is the part of the communication process that is most individualized and requires the most time. It is helpful to partition the schematic into understandable pieces." [IDEF3 Process Description Capture Method Report AL-TR-1995-XXXX. idef.com/ pdf/ Idef3_ fn.pdf]
The diagram sample "IDEF3 object state transition schematic" was created using the ConceptDraw PRO diagramming and vector drawing software extended with the solution "IDEF Business Process Diagrams" from the area "Business Processes" of ConceptDraw Solution Park.
IDEF3 business process diagram
Business Process Modeling with ConceptDraw

Types of Flowcharts

UML Sequence Diagram. Design Elements
")

 Entity-Relationship Diagram (ERD)
Entity-Relationship Diagram (ERD) solution extends ConceptDraw PRO software with templates, samples and libraries of vector stencils from drawing the ER-diagrams by Chen's and crow’s foot notations.
Design Elements for UML Diagrams

- Cross-Functional Flowchart (Swim Lanes) | Swim Lane Diagrams ...
- Sales Process Flowchart. Flowchart Examples | Sales Process Steps ...
- 4 Level pyramid model diagram - Information systems types | 5 Level ...
- Euclidean algorithm - Flowchart | Basic Flowchart Symbols and ...
- Machine Drawing Symbols For Different Operation
- How to Create Flowcharts for an Accounting Information System ...
- Process Flowchart | How to Draw a Chemical Process Flow Diagram ...
- How to Draw a Chemical Process Flow Diagram | How to Create a ...
- How to Create a Mechanical Diagram | Mechanical Drawing ...
- IDEF3 Standard | How to create an IDEF3 diagram using ...
- Euclidean algorithm - Flowchart | Solving quadratic equation ...
- Computer network system design diagram | Software Defined ...
- Business Process Mapping — How to Map a Work Process | Work ...
- Process Flowchart | Business Process Mapping — How to Map a ...
- How to Draw a Computer Network Diagrams | Basic CCTV System ...
- Mechanical Drawing Symbols | Technical Drawing Software ...
- Technical Drawing Software | Electrical Drawing Software | How to ...
- Transition schematic - IDEF3 diagram example | Basic Flowchart ...
- Completed transition schematic - IDEF3 diagram | Transition ...
- Process Flowchart | How to Draw a Chemical Process Flow Diagram ...