Visualize Stakeholder Analysis

Stakeholder Mapping Tool

Stakeholder Onion Diagrams

How To Create Onion Diagram

Pyramid Diagram

Business Calendar

 Stakeholder Onion Diagrams
The Stakeholder Onion Diagram is often used as a way to view the relationships of stakeholders to a project goal. A basic Onion Diagram contains a rich information. It shows significance of stakeholders that will have has influence to the success achieve
HelpDesk
How to Create a Stakeholder Onion Diagram Using ConceptDraw PRO

Netflow architecture. Computer and Network Examples


Project — Assigning Resources


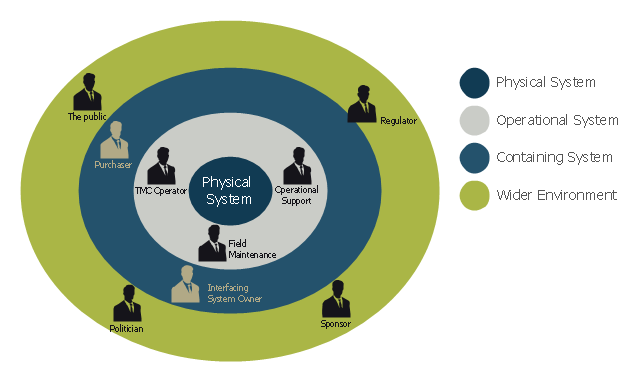
This onion diagram example was designed on the base of figure "Stakeholders for a System" in the slide presentation "A103: Introduction to ITS Standards Requirements Development" from the U.S. Department of Transportation (US DOT) website.
"“Stakeholders for a System.” A graphic of four concentric circles arranged like an archery target. The innermost circle is a reddish tan. The three bands of colors that are further from the center are in lighter shades of tan. This is called an “onion diagram” as onions are made up of multiple layers. The inner circle is labeled “Physical System.” The next layer outward is labeled “Operational System.” The next layer outward is labeled “Containing System.” The outermost layer is labeled “Wider Environment.” There are smaller black graphics of person positioned in the different layers of the diagram. Each person has a project role next to it as follows: 1) Inner Circle has no people – It represents the system; 2) Next Layer Outward has three people labeled TMC Operator, Field Maintenance, and Operational Support respectively; 3) Next Layer Outward has two people labeled Interfacing System Owner and Purchaser respectively; and 4) Outermost Layer has four people labeled Sponsor of the Project, Regulatory Agency, Public, and Politician respectively. The picture demonstrates while they are all stakeholders, different stakeholders have different levels of influence on the physical system to be defined. The most influence coming from those closest to the center."
[pcb.its.dot.gov/ standardstraining/ mod04/ ppt/ m04ppt.htm]
The onion diagram example "System stakeholders diagram" was drawn using the ConceptDraw PRO software extended with the Stakeholder Onion Diagrams solution from the Management area of ConceptDraw Solution Park.
Onion diagram example
How Cloud Computing Works

Cloud Computing Architecture Diagrams

What is Cloud Computing

- Stakeholder Mapping Tool | Circle Spoke Diagram Template ...
- Visualize Stakeholder Analysis | Components of ER Diagram ...
- Stakeholder Onion Diagrams | Flow Chart Symbols | Cloud ...
- Stakeholder Mapping Tool | Visualize Stakeholder Analysis ...
- Stakeholder Onion Diagrams
- Stakeholder Mapping Tool | Stakeholder Management System ...
- Stakeholder Onion Diagrams | How To Create Onion Diagram | How ...
- Design elements - Stakeholder icons | Stakeholder Onion Diagram ...
- Gane Sarson Diagram | Stakeholder Mapping Tool | How to Create ...
- Design elements - Stakeholder icons | Stakeholder Onion Diagrams ...
- Stakeholder Mapping Tool | Visualize Stakeholder Analysis ...
- Stakeholder Mapping Tool | Basic Flowchart Symbols and Meaning ...
- How To Create Onion Diagram | Stakeholder Mapping Tool ...
- Continent Maps | Sales Dashboard | Stakeholder Onion Diagrams ...
- Economic sector weightings | Stakeholder Mapping Tool ...
- Stakeholders Circle Diagram
- Stakeholder Management System | Stakeholder Mapping Tool ...
- Visualize Stakeholder Analysis | Stakeholder Management System ...
- Mind Mapping That Indicate The Stakeholders In The Community