Social Media Response
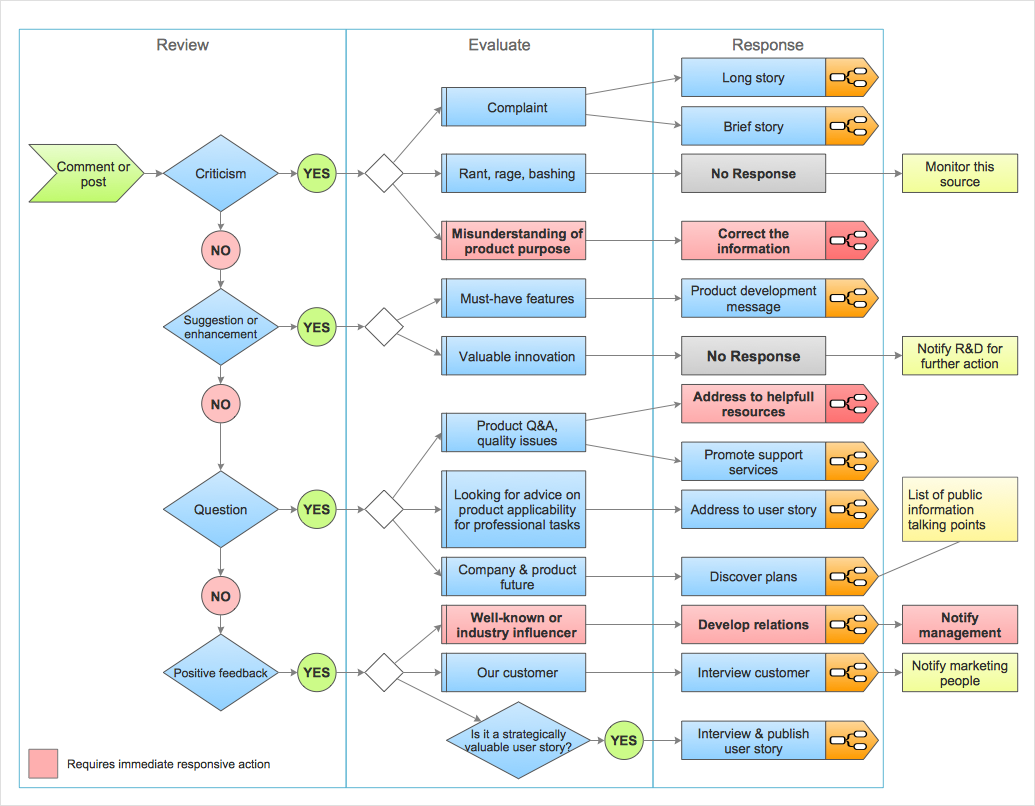
This solution extends ConceptDraw DIAGRAM and ConceptDraw MINDMAP with the ability to draw interactive flow charts with action mind map templates, to help create an effective response to applicable social media mentions.
How to Create a Social Media DFD Flowchart
Interactive tool helps you create a social media DFD flowchart to find the appropriate response to social media mentions quickly.It allows companies to be more effective in timely messaging thanks to the ability for rapid response to a customer′s post in social media. This saves budget for companies who use social media for promoting and as a lead generation tool.
HelpDesk
How to Organize a Social Media Activity
Interactive Flowcharts describes the social media response process. The Action mind map shows examples of messages, and also defines the main objective of messaging for a specific situation. ConceptDraw Social Media Response solution helps to organize the process of response for interactions occurring in social media.Business Diagram Software
ConceptDraw business diagram Software is the most powerful business and relational charting software. Create advanced, completely customizable flow charts, organizational charts, business process diagrams, work flow diagrams, audit diagram, value stream maps, TQM diagrams, ERD diagrams, EPC diagrams, marketing diagrams, cause and effect diagrams, dashboards, infographics and other relational business diagrams from your data.HelpDesk
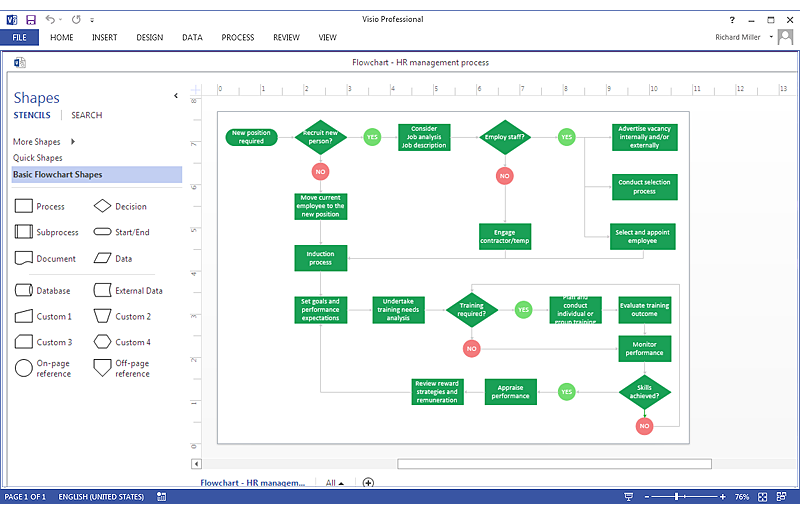
How To Create MS Visio Cross-Functional Flowchart
Cross-functional is a process involving several functional layers. Such processes typically cause the most problems, and therefore, is the most potential for improvement. Cross-functional business processes usually illustrate the processes of product development, commercial proposal development, the order execution process - everything, that involves several departments. The package of possible improvements - is the task of re-engineering. To illustrate the cross-functional processes often use cross-functional flowchart is often used to illustrate the cross-functional processes. ConceptDraw DIAGRAM allows you to easily create a cross-functional flowchart. Then, you can export it to MS Visio VSDX or VDX format and successfully share it with your colleagues still using MS Visio.HelpDesk
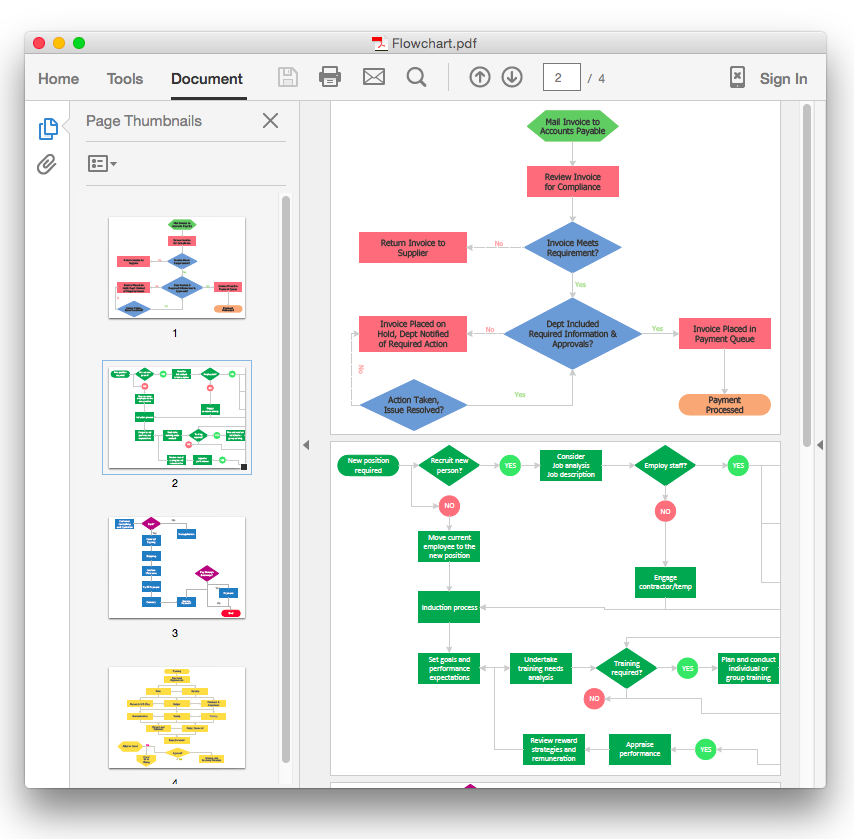
How To Convert a Flowchart to Adobe PDF
ConceptDraw DIAGRAM allows you to easy exchange your drawings between different computers with different operating systems and applications using it's export capabilities. You can get clear business documentation in pdf format and avoid any problems while communicating it with stakeholders.HelpDesk
How To Create MS Visio Flowchart
A flowchart is a diagram that successively depicts all process steps. The basic flowchart is the easiest and understandable type of flowchart. Making a processor workflow step-by-step visualization helps you to better understand it and effectively communicate with your audience. Flowcharting is the best way to do this. Using ConceptDraw DIAGRAM you can design flowcharts of any complexity on Windows or macOS. Then you can export them to Visio format to share with the users of MS Visio. Moreover, using ConceptDraw DIAGRAM you can open and edit a flowchart made in Visio, regardless of whether you are using macOS or Windows.HelpDesk
How to Import MS Project File to a Mind Map Using the Project Exchange Solution
ConceptDraw MINDMAP can export a mind map to MS Project; it can also import a project file from MS Project, making a working visual map of a planned project. ConceptDraw MINDMAP supports inputting external data into a map with one click. Input capabilities are critical because it makes your data visual. When your data is visual, you can manage and communicate it using newly generated documents and/or presentations. Data you can input into your map can come from just about anywhere. Data can come from Microsoft Word, Excel, Outlook, Project, the web, a mind map, and other electronic sources. You can input data as a task list, resource list, Gantt chart, brainstorm or search results.Cross-Functional Flowcharts
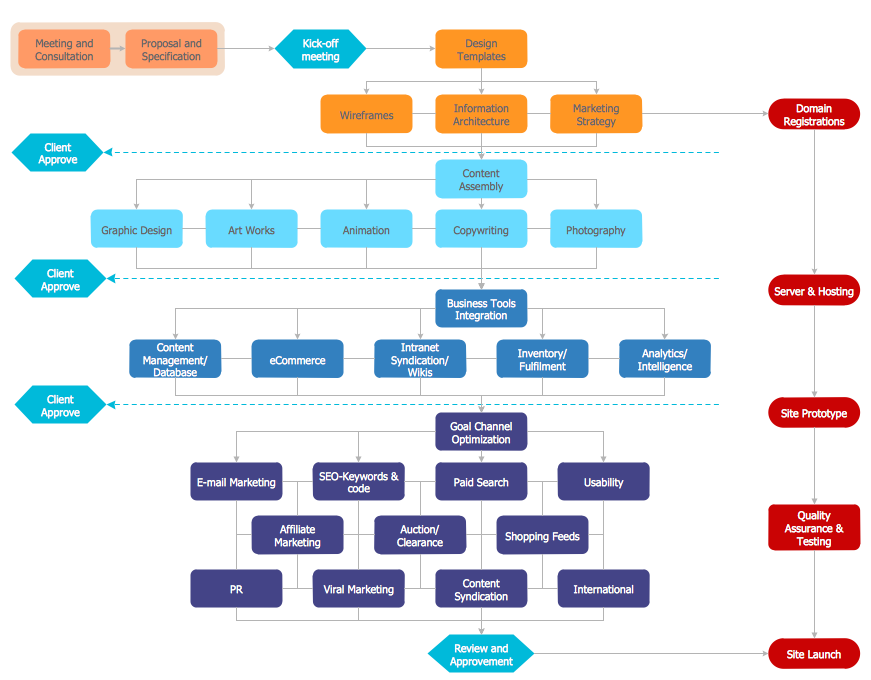
Cross-functional flowcharts are powerful and useful tool for visualizing and analyzing complex business processes which requires involvement of multiple people, teams or even departments. They let clearly represent a sequence of the process steps, the order of operations, relationships between processes and responsible functional units (such as departments or positions).
HelpDesk
How to Make a Rapid Draw Object
The Rapid Draw technology is an automatic drawing system. It is designed to significantly reduce the time of creating flowcharts and diagrams. Especially those, consisting from some typical entities. You can extend the standard ConceptDraw DIAGRAM object libraries with new objects by customizing any item from any library and assigning it with Rapid Draw features. You can quickly create and edit complex drawings using Rapid Draw technology and your self-created objects.ConceptDraw DIAGRAM : Able to Leap Tall Buildings in a Single Bound
ConceptDraw DIAGRAM is the world’s premier cross-platform business-diagramming tool. Many, who are looking for an alternative to Visio, are pleasantly surprised with how well they can integrate ConceptDraw DIAGRAM into their existing processes. With tens of thousands of template objects, and an easy method for importing vital custom objects from existing Visio documents, ConceptDraw DIAGRAM is a powerful tool for making extremely detailed diagrams, quickly and easily.HelpDesk
How to Simplify Flow Charting on PC
Flowcharts are the best tool for staking out a huge and complex process into some small readable parts. The use of standard symbols that make it clear for a wide audience makes a software tool preferred for this task. The core of a successful flowchart is its simplicity. That is why often before beginning making flowchart through software, people draw the sketch on a piece of paper. Designing an effective flowchart means the combination of the data needed to be shown and the simplicity with which you depict it. In ConceptDraw DIAGRAM it really is so simple to draw even the most complex flowcharts. Use Rapid Draw technology for the best results.HelpDesk
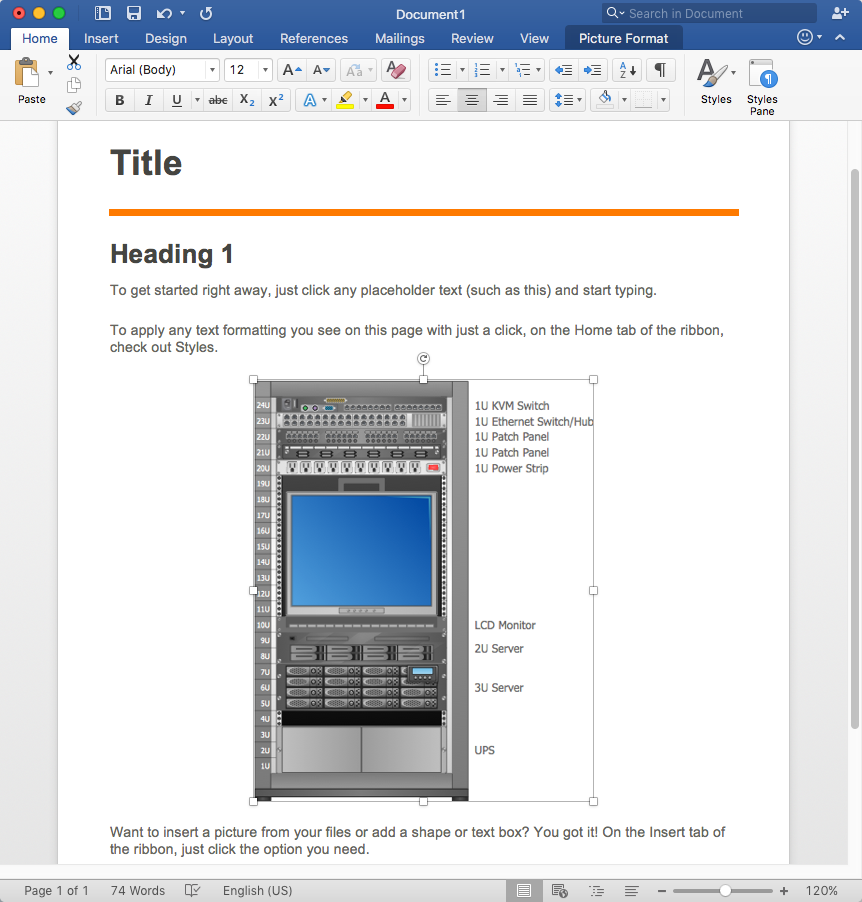
How to Add a Rack Diagram to MS Word Document
Rack Diagram depicts the structure of network equipment installation and provides the network administrator with the base to support electronic equipment, power, cooling, and cable management. ConceptDraw DIAGRAM allows you to easily create a diagram that will help to detail the type of rack equipment that best fits your needs and then lets you insert the scheme of rack configuration into the network documentation pack. ConceptDraw DIAGRAM allows you to easily create rack configuration diagrams and then insert them into an MS Word document.HelpDesk
How to Create a Computer Network Diagram
Computer Network diagram is intended to depict how a computer network is built and connected. It shows how data transfers between connections and presents an overview of hardware and devices used.With the ConceptDraw solution for Computer Network Diagrams, system administrators, network architects, and other related IT specialists have a perfect drawing tool that supplies adjective vector stencils representing hardware, telecom devices, and logical symbols that enhance possibilities in network diagramming, however, complex the real network may be.
HelpDesk
How to Add a Bubble Diagram to MS Word
A bubble diagram is used the same purpose as a scatter diagram, but in the case, if the data has three dimensions, each of that containing the set of values. A bubble chart is a diagram in which the data points are replaced with bubbles, and the size of the bubbles represents some additional dimension of the data. A bubble chart does not have the axis. The sizes of the bubbles are determined by the values in the third dimension. Any additional information about the entities beyond their three primary dimensions can be depicted by rendering bubbles in colors and patterns that are selected in a certain way. The legend containing the further information can be added to a bubble diagram. ConceptDraw DIAGRAM allows you to easily create various business management and marketing charts, including bubble diagrams and then add them to an MS Word document.HelpDesk
How to Simplify Flow Charting on Mac
A flowchart is a great way to present any complex process in a simple to understand manner. A flowchart is perhaps the most common form of diagrams used in both technical and social fields. Since a flowchart is a method that allows describing visually any consequent process, it can be used to show the flow of logic of any process. In ConceptDraw DIAGRAM it really is simple to draw even the most complex flowcharts. Use Rapid Draw technology for the best results.Audit Flowcharts
Audit flowcharts solution extends ConceptDraw DIAGRAM software with templates, samples and library of vector stencils for drawing the audit and fiscal flow charts.
HelpDesk
How to Create a New Library
Sometimes, when creating a diagram, you need to use a large set of elements from different libraries. If you are using ConceptDraw , in such case, we recommend you to create a new library, which consists of vector library objects from other ConceptDraw libraries. You also can add some custom unique objects into such library. Each object that contains in a new library can be provided with a unique description and keyword list.Thus, the new library and its objects will be indexed to be searched and used in the further diagrams.
Comparing ConceptDraw DIAGRAM to Omnigraffle
Comparing ConceptDraw DIAGRAM to Omnigraffle - Cross-platform product. While most drawing tools are designed for use on one operating system, ConceptDraw DIAGRAM is available as two independent and concurrent versions on both Macintosh (macOS) and PC (Windows).License is per named user. That means you can use a single license for Macintosh and PC. Users can install at work and at home with a single license.
- How to Create a Social Media DFD Flowchart | Business Diagram ...
- Social Media Response Flowchart
- How to Create a Social Media DFD Flowchart | What is Interactive ...
- Social Media Response | How to Create a Social Media DFD ...
- Flowchart For Social Network
- Flowchart on Bank. Flowchart Examples | Bank social media ...
- Social Networking Flowchart
- UML Use Case Diagram Example Social Networking Sites Project ...
- How to Connect Social Media DFD Flowchart with Action Maps ...
- Social Media Flowchart
- Social Media Response
- How to Create a Social Media DFD Flowchart | Venn diagram ...
- Bank social media response flowchart | ConceptDraw PRO: Able to ...
- Bank social media response flowchart | Computer and Networks ...
- How to Create a Social Media DFD Flowchart | Manage Social ...
- Social Media Response Flowcharts - diagramming software ( Mac ...
- How to Create a Social Media Flowchart | What is SWOT Analysis in ...
- Data Flow Diagrams | Applications | Flowchart Software | Social ...
- UML Use Case Diagram Example Social Networking Sites Project ...
- How to Create a Social Media DFD Flowchart | Data Flow Diagrams ...
- ERD | Entity Relationship Diagrams, ERD Software for Mac and Win
- Flowchart | Basic Flowchart Symbols and Meaning
- Flowchart | Flowchart Design - Symbols, Shapes, Stencils and Icons
- Flowchart | Flow Chart Symbols
- Electrical | Electrical Drawing - Wiring and Circuits Schematics
- Flowchart | Common Flowchart Symbols