How to Create a Social Media DFD Flowchart
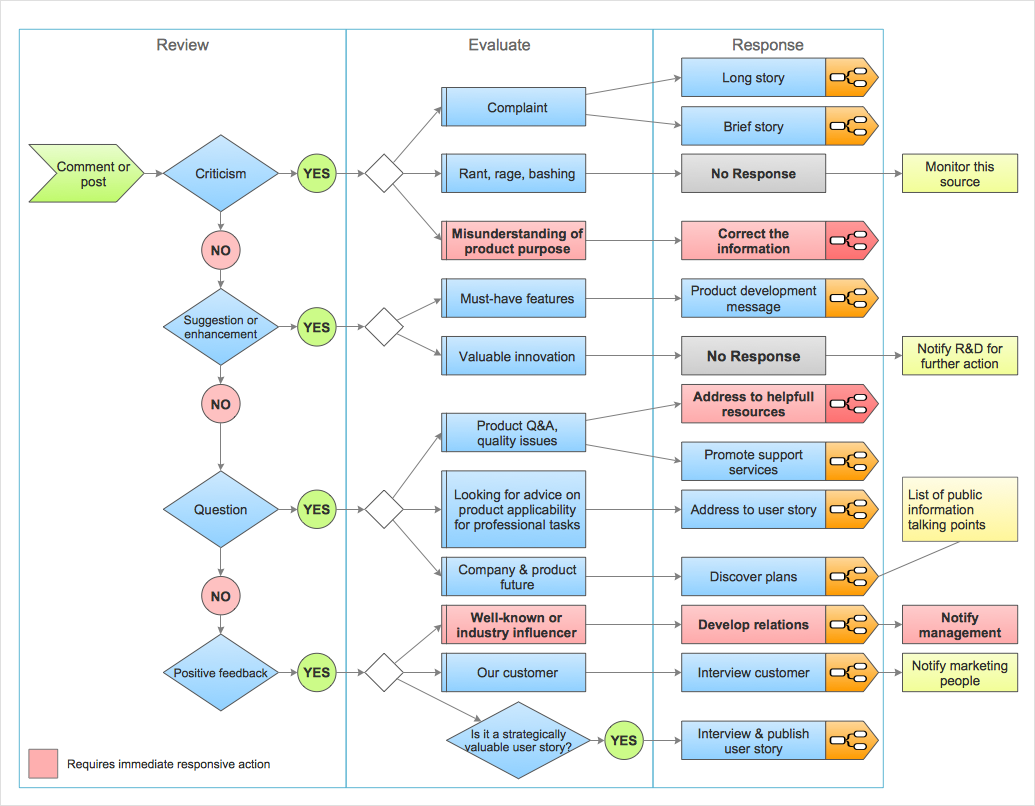
The use of social media in modern conditions helps the companies to be more effective in timely messaging - actively and rapidly response to a customer posts in social media, to find quickly the appropriate response to social media mentions, to save greatly the budget. Many companies even use the social media as a lead tool for promotion. But how to create a Social Media DFD Flowchart, Social Media Response Flowchart or Action Mind Map fast and easy? ConceptDraw DIAGRAM ector graphical software and Social Media Response solution included to ConceptDraw Solution Park assist greatly in their creation. This solution improves the quality of content in social media and helps to build an active customer community. The samples and examples included to Social Media Response solution are helpful for social media teams in developing a social media strategy, in refining and organizing the response process, in creation training materials by trainers and consultants for education the social media groups on how to accomplish the most effectiveness in their daily work.
 Social Media Response
This solution extends ConceptDraw DIAGRAM and ConceptDraw MINDMAP with the ability to draw interactive flow charts with action mind map templates, to help create an effective response to applicable social media mentions.
HelpDesk
How to Organize a Social Media Activity
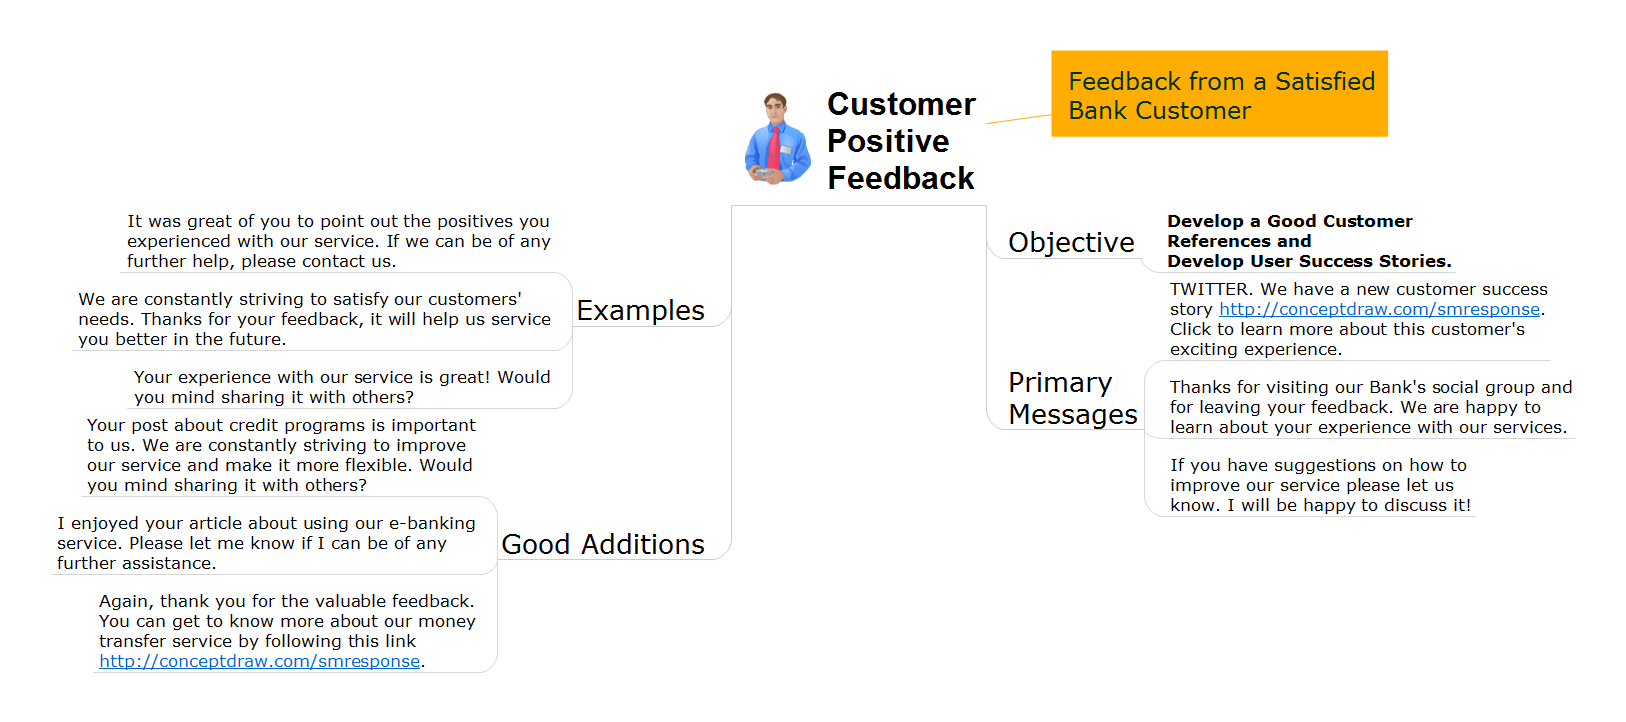
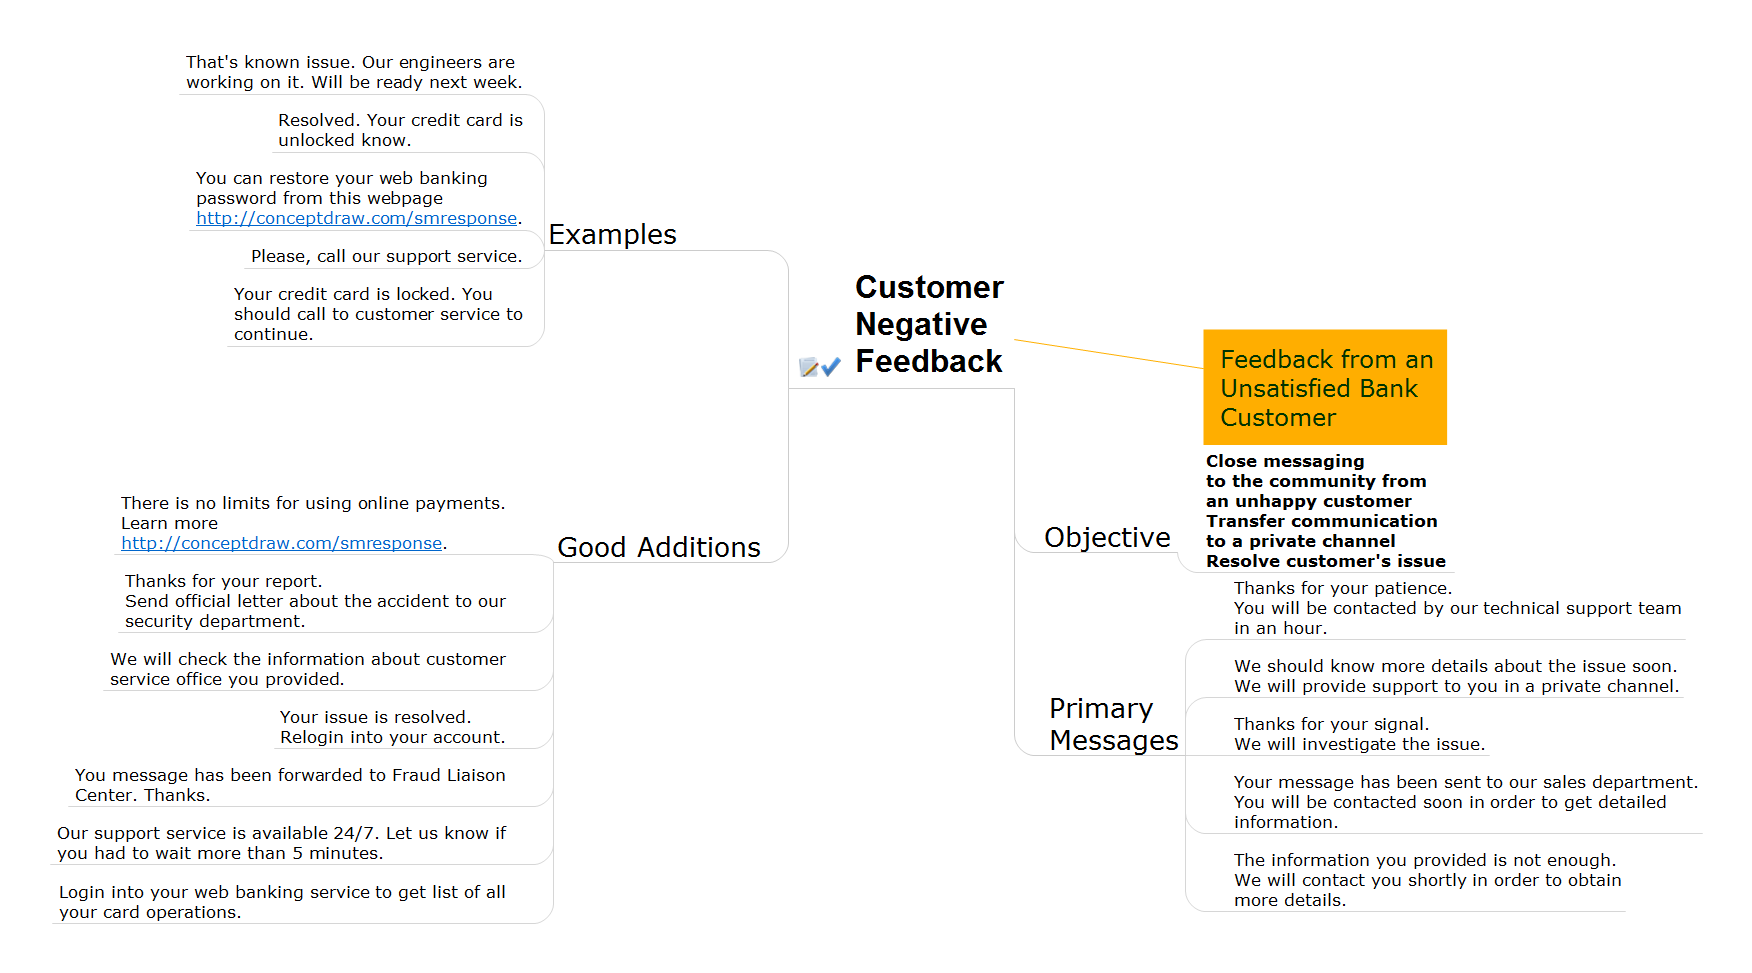
Interactive Flowcharts describes the social media response process. The Action mind map shows examples of messages, and also defines the main objective of messaging for a specific situation. ConceptDraw Social Media Response solution helps to organize the process of response for interactions occurring in social media.What is Interactive Flowcharts
Organizing and Selecting Social Media Response Messages. Interactive Flowcharts can change the way one creates and organizes their social media response process.Business Diagram Software
When managing the projects, people, or networks, there are daily designed and used different types of Business diagrams, so the powerful drawing software will be very useful for this. ConceptDraw DIAGRAM with large quantity of business solutions will meet your needs and will help you convey your ideas successful and rapidly, no matter are you professional or beginner. It is the best choice for business specialists and technical professionals who need quickly and easily explore, visualize, and communicate information. ConceptDraw DIAGRAM business diagram software is the most powerful business software and relational charting software. Create advanced, completely customizable Business Process Diagrams, Business Flow Charts, Work Flow Diagrams, Organizational Charts, Audit diagrams, Marketing diagrams, Value Stream Maps, TQM diagrams, ERD diagrams, EPC diagrams, Cause and Effect diagrams, Infographics, Dashboards, and other Relational business diagrams from your data using the powerful drawing tools of ConceptDraw Solution Park.
Social Media Response Management DFD Charts - software tools
ConceptDraw is your tool for driving social integration and managing change across and streamline social media processes of your organisation.This tool keeps the entire team on the same page allowing you to realize your social media strategy, improve the quality of your answers, and minimize the time it takes to respond.
Create Response Charts
Visual navigation through the stages of a response process helps you locate specific actions to be taken via Action Mind Maps. Use ConceptDraw DIAGRAM and ConceptDraw MINDMAP for organize the process of response for interactions occurring in social media.HelpDesk
How To Create MS Visio Cross-Functional Flowchart
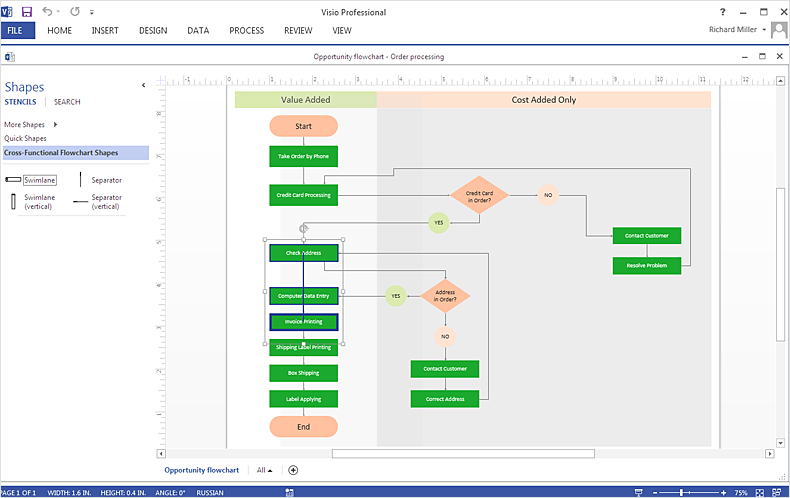
Cross-functional is a process involving several functional layers. Such processes typically cause the most problems, and therefore, is the most potential for improvement. Cross-functional business processes usually illustrate the processes of product development, commercial proposal development, the order execution process - everything, that involves several departments. The package of possible improvements - is the task of re-engineering. To illustrate the cross-functional processes often use cross-functional flowchart is often used to illustrate the cross-functional processes. ConceptDraw DIAGRAM allows you to easily create a cross-functional flowchart. Then, you can export it to MS Visio VSDX or VDX format and successfully share it with your colleagues still using MS Visio.The Means to Respond to Social Media Mentions
Which trends are on the horizont of social media? What’s we have to prepare for? Look into the future with ConceptDraw products.HelpDesk
How To Create MS Visio Flowchart
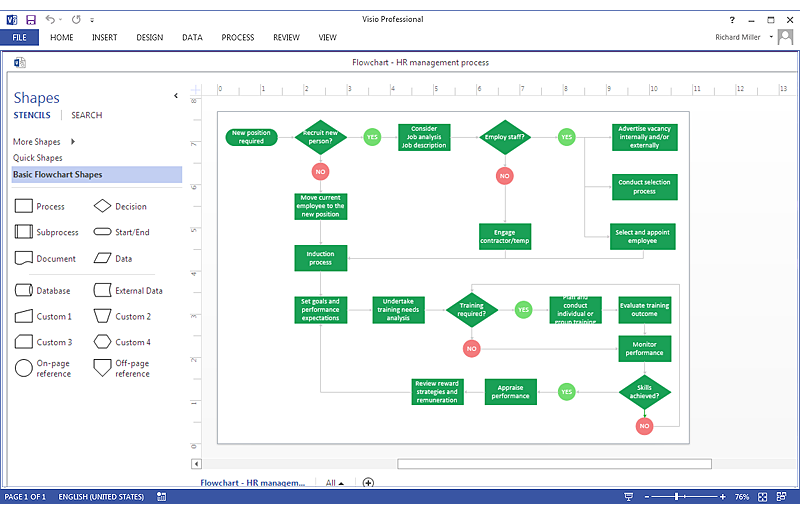
Making a process or work flow step-by-step visualization helps you to better understand it and effectively communicate with your audience. Flowcharting is the best way to do this. Flowchart is a diagram that successively depicts all process steps. Basic flowchart is the most easy and understandable type of a flowchart. Using ConceptDraw DIAGRAM you can design flowcharts of any complexity on Windows or OS X. Then you can export them to Visio format to share with the users of MS Visio. Moreover, using ConceptDraw DIAGRAM you can open and edit a flowchart made in Visio, regardless of whether you are using OS X or Windows.That Helps Professional Social Media Teams
Using a combination of Interactive Flowcharts with Action Mind Maps helps professional social media teams be more proactive and prepared with proper responses. Social Media Response solution minimizes Time-to-Response, improves the quality of responses, and assists in your entire marketing strategy.HelpDesk
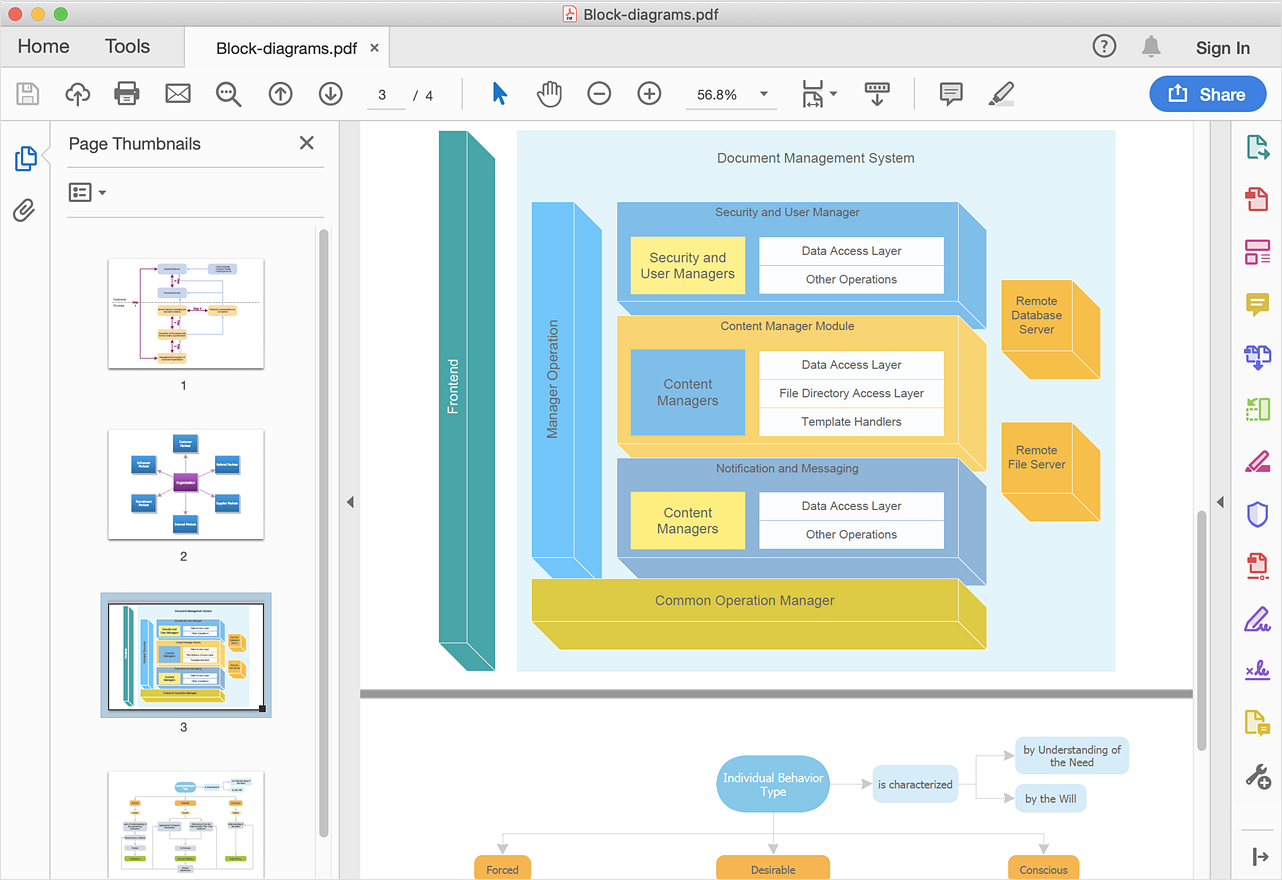
How To Convert a Block Diagram to Adobe PDF
ConceptDraw DIAGRAM allows you to easily share your business documentation between different computers with different operating systems and applications using its export capabilities. You can get a clear business graphic pack in pdf format and avoid any problems while communicating them with stakeholders.HelpDesk
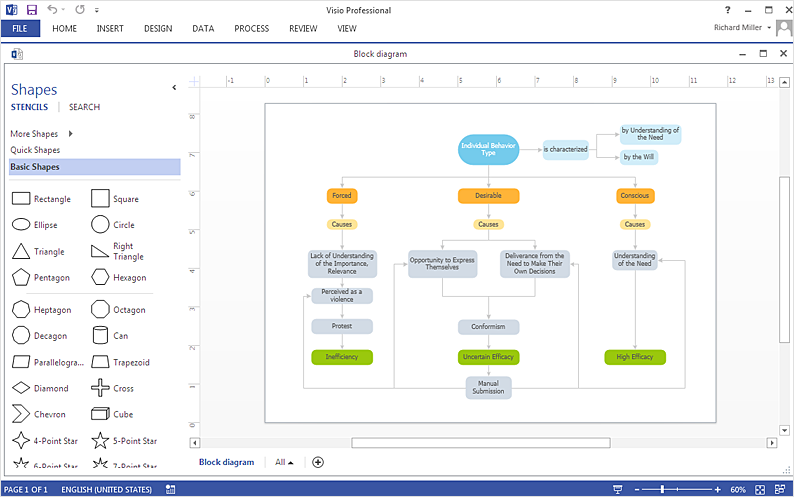
How To Create an MS Visio Block Diagram
ConceptDraw DIAGRAM allows you to easily create block diagrams of any complexity and then make an MS Visio file from your diagram in a single click.HelpDesk
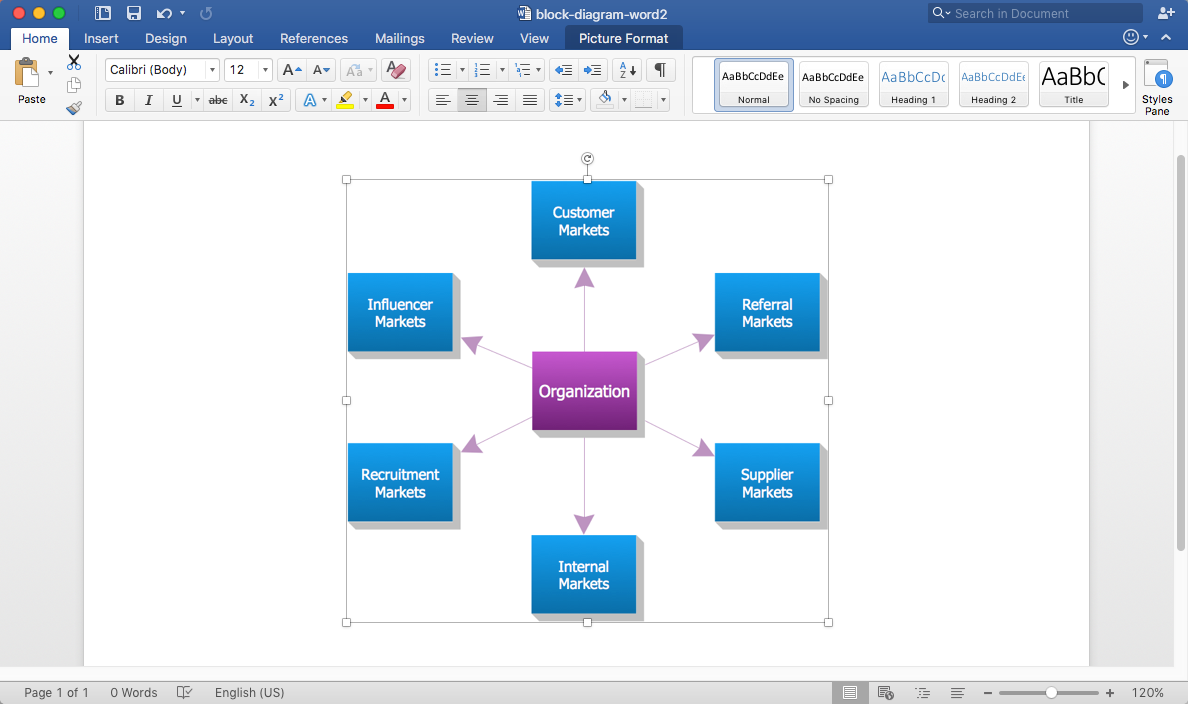
How to Add a Block Diagram to an MS Word ™ Document
Block diagram consists of graphic blocks. Blocks are connected by lines or arrows. Block diagrams are used to show the relationship between parts of some systems. It can be used for the development of new systems or to improve existing ones. The structure of the block diagram gives a high-level overview of the major components of the system, as well as the important relationships. Using the block diagrams, you can more effectively present the business data contained in your MS Word documents. ConceptDraw DIAGRAM allows you to easily create block diagrams and then insert them into an MS Word document.HelpDesk
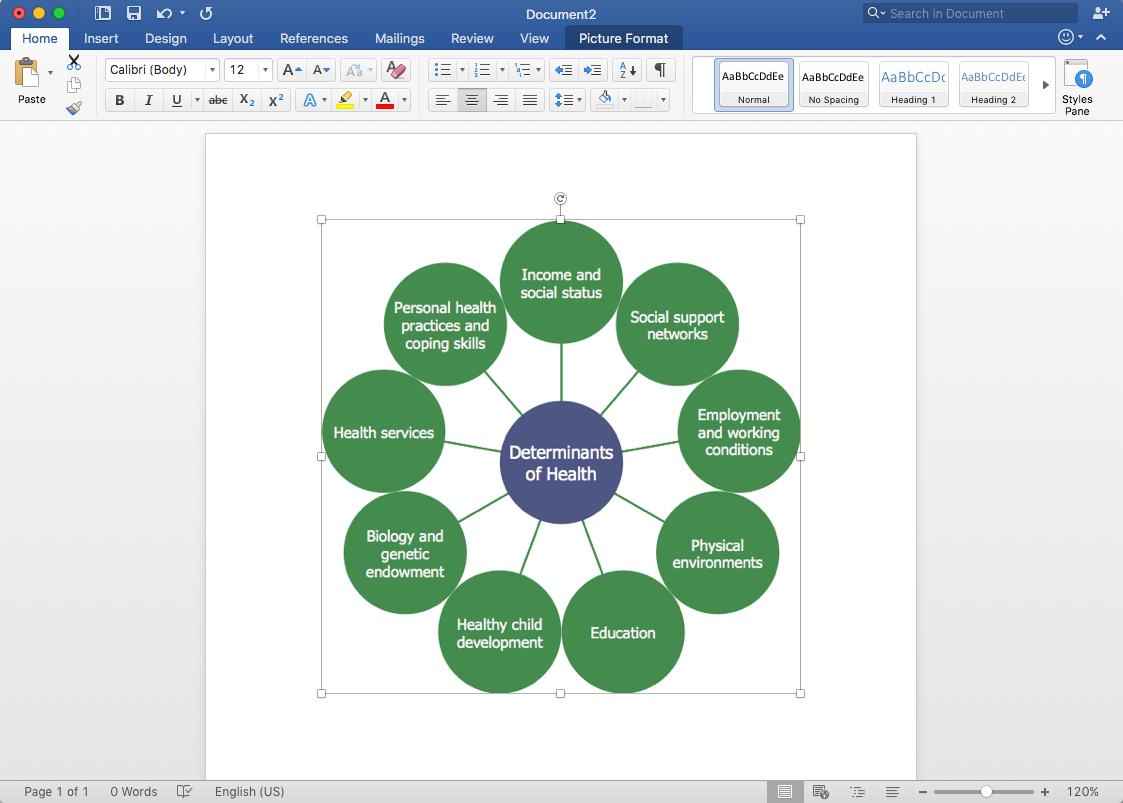
How to Add a Circle-Spoke Diagram to MS Word Document
ConceptDraw DIAGRAM allows you to easily create various marketing charts, including the circle-spoke diagrams and then insert them into an MS Word document.HelpDesk
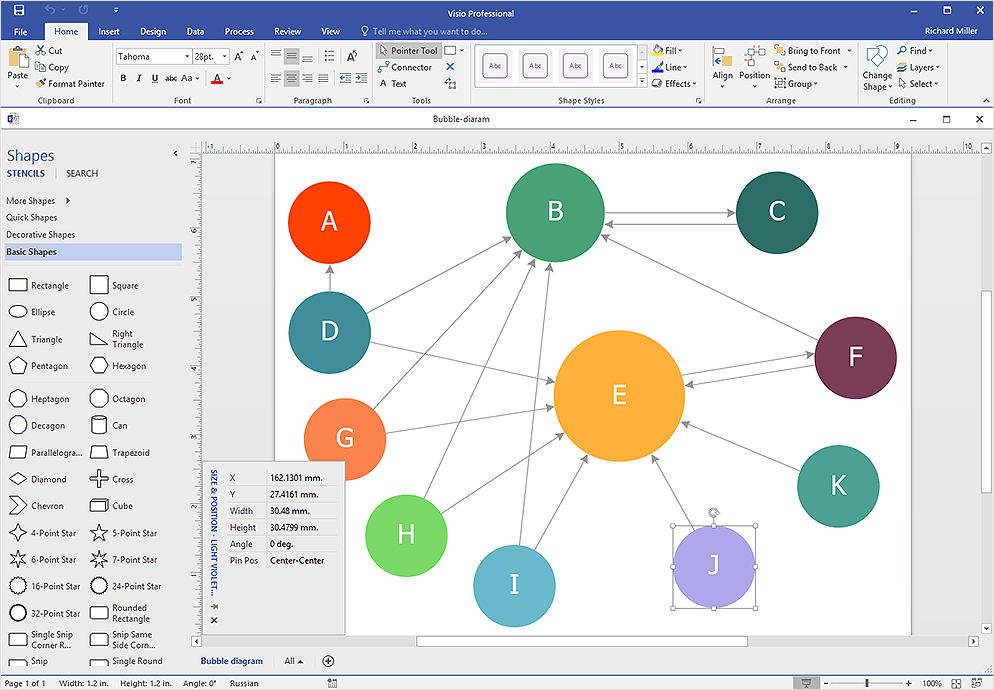
How To Create Visio Bubble Chart
ConceptDraw DIAGRAM allows you to easily create business charts and diagrams of any complexity, including the bubbles diagram and then make a MS Visio file from your diagram in a few simple steps.HelpDesk
How to Add a Bubble Diagram to MS Word
A bubble chart is a diagram in which the data points are replaced with bubbles, and the size of the bubbles represents some additional dimension of the data. A bubble chart does not have the axis. A bubble chart can be used instead of a scatter diagram if the data has three dimensions, each of that containing the set of values. The sizes of the bubbles are determined by the values in the third dimension. Any additional information about the entities beyond their three primary dimensions can be depicted by rendering bubbles in colors and patterns that are selected in a certain way. The legend containing the further information can be added to a bubble diagram. ConceptDraw DIAGRAM allows you to easily create various business management and marketing charts, including bubble diagrams and then add them to a MS Word document.HelpDesk
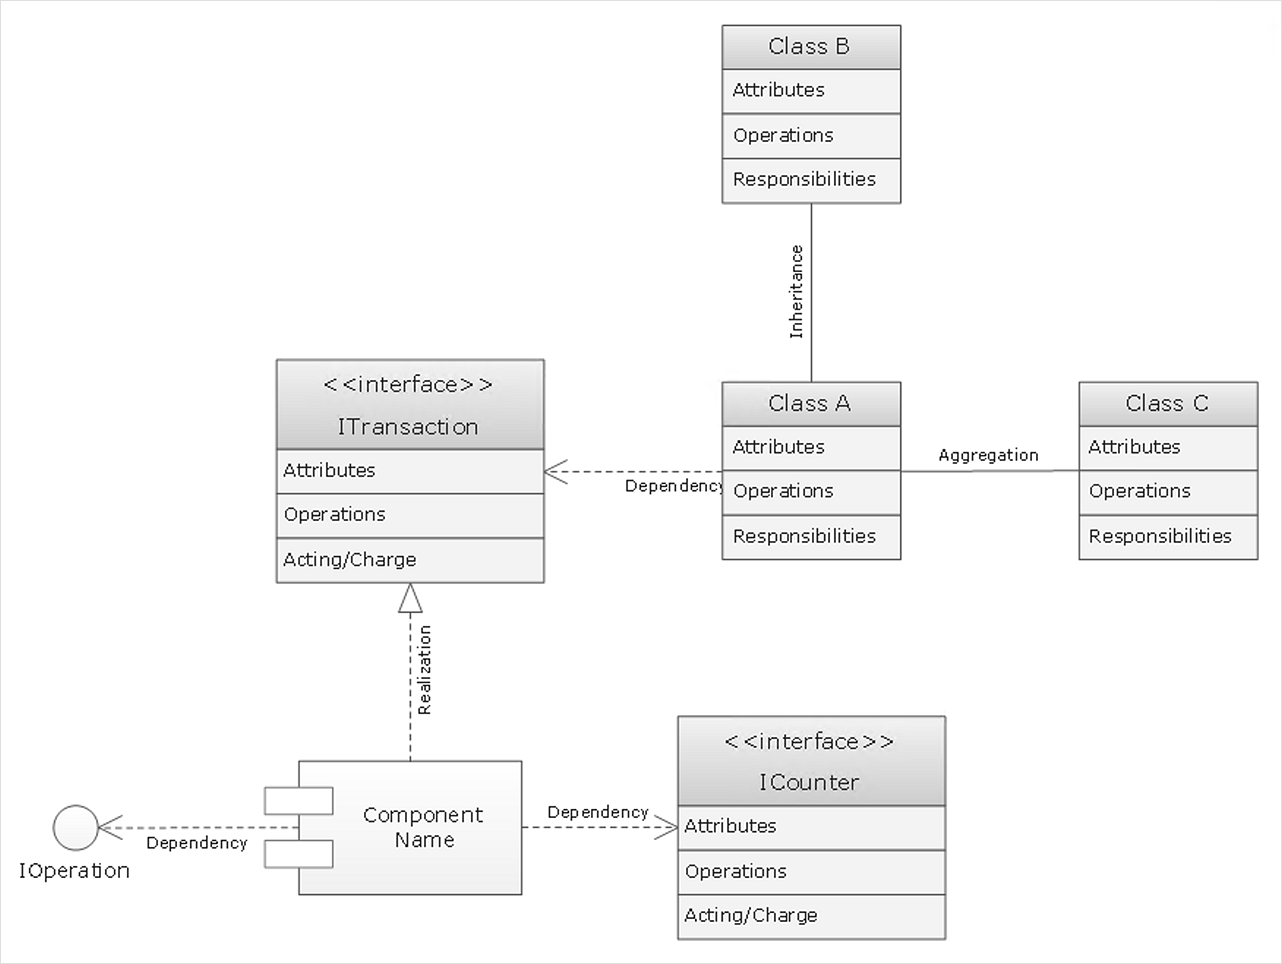
How to Create a UML Diagram Using Rapid UML Solution
ConceptDraw DIAGRAM is a perfect tool to draw UML Diagrams. The ability to create UML diagrams in ConceptDraw DIAGRAM is contained in the Rapid UML Solution. This solution provides a set of special tools for creating UML diagrams.- How to Create a Social Media DFD Flowchart | Business Diagram ...
- Marketing Flow Chart
- How to Create a Social Media Flowchart | Social Media Response ...
- How to Create a Social Media DFD Flowchart | What is Interactive ...
- Social Media Response | Bank social media response flowchart ...
- Social Media Response Flowchart
- How to Connect Social Media Flowchart with Action Maps | Social ...
- How to Create a Social Media Flowchart | Cross-Functional ...
- How to Connect Social Media Flowchart with Action Maps | Cross ...
- Social Media Response | Business Diagram Software | Create ...
- How to Connect Social Media Flowchart with Action Maps | Social ...
- How to Create a Social Media DFD Flowchart | Online store social ...
- How to Create a Social Media Flowchart | Mind Maps for Business ...
- How to Create a Social Media Flowchart | Social Media Response ...
- Social Media Flowchart
- How to Draw a Flowchart | How to Connect Social Media Flowchart ...
- Social Networking Flowchart
- Social strategy - Pyramid diagram | Online store social media ...
- How to Create a Social Media DFD Flowchart | Social Media ...
- How to Create a Social Media DFD Flowchart | Pyramid Diagram ...

