HelpDesk
How to Create a SIPOC Diagram
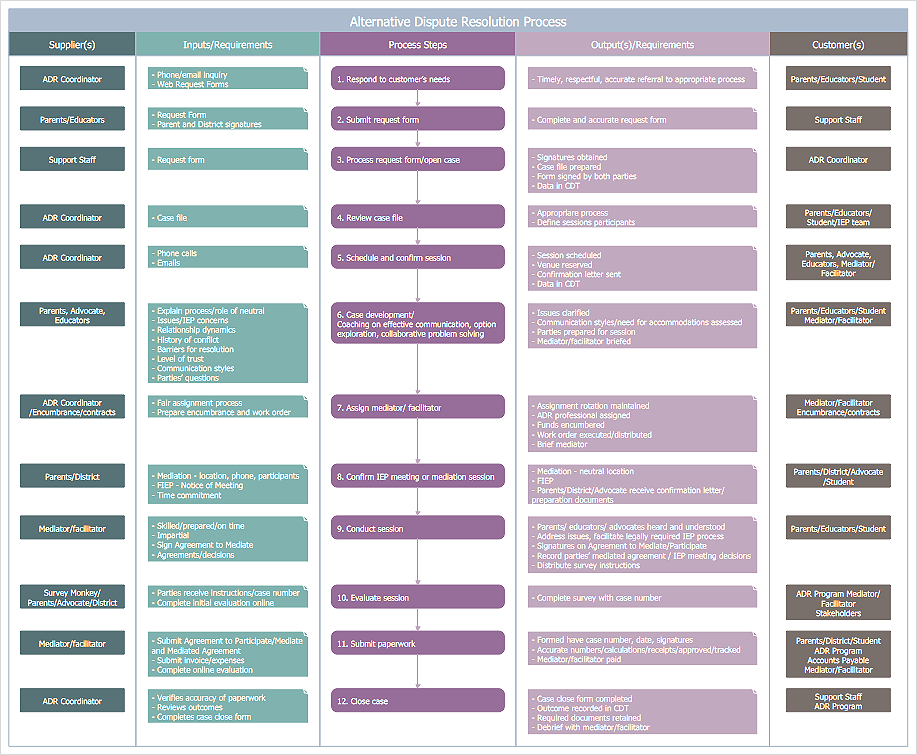
SIPOC Diagram

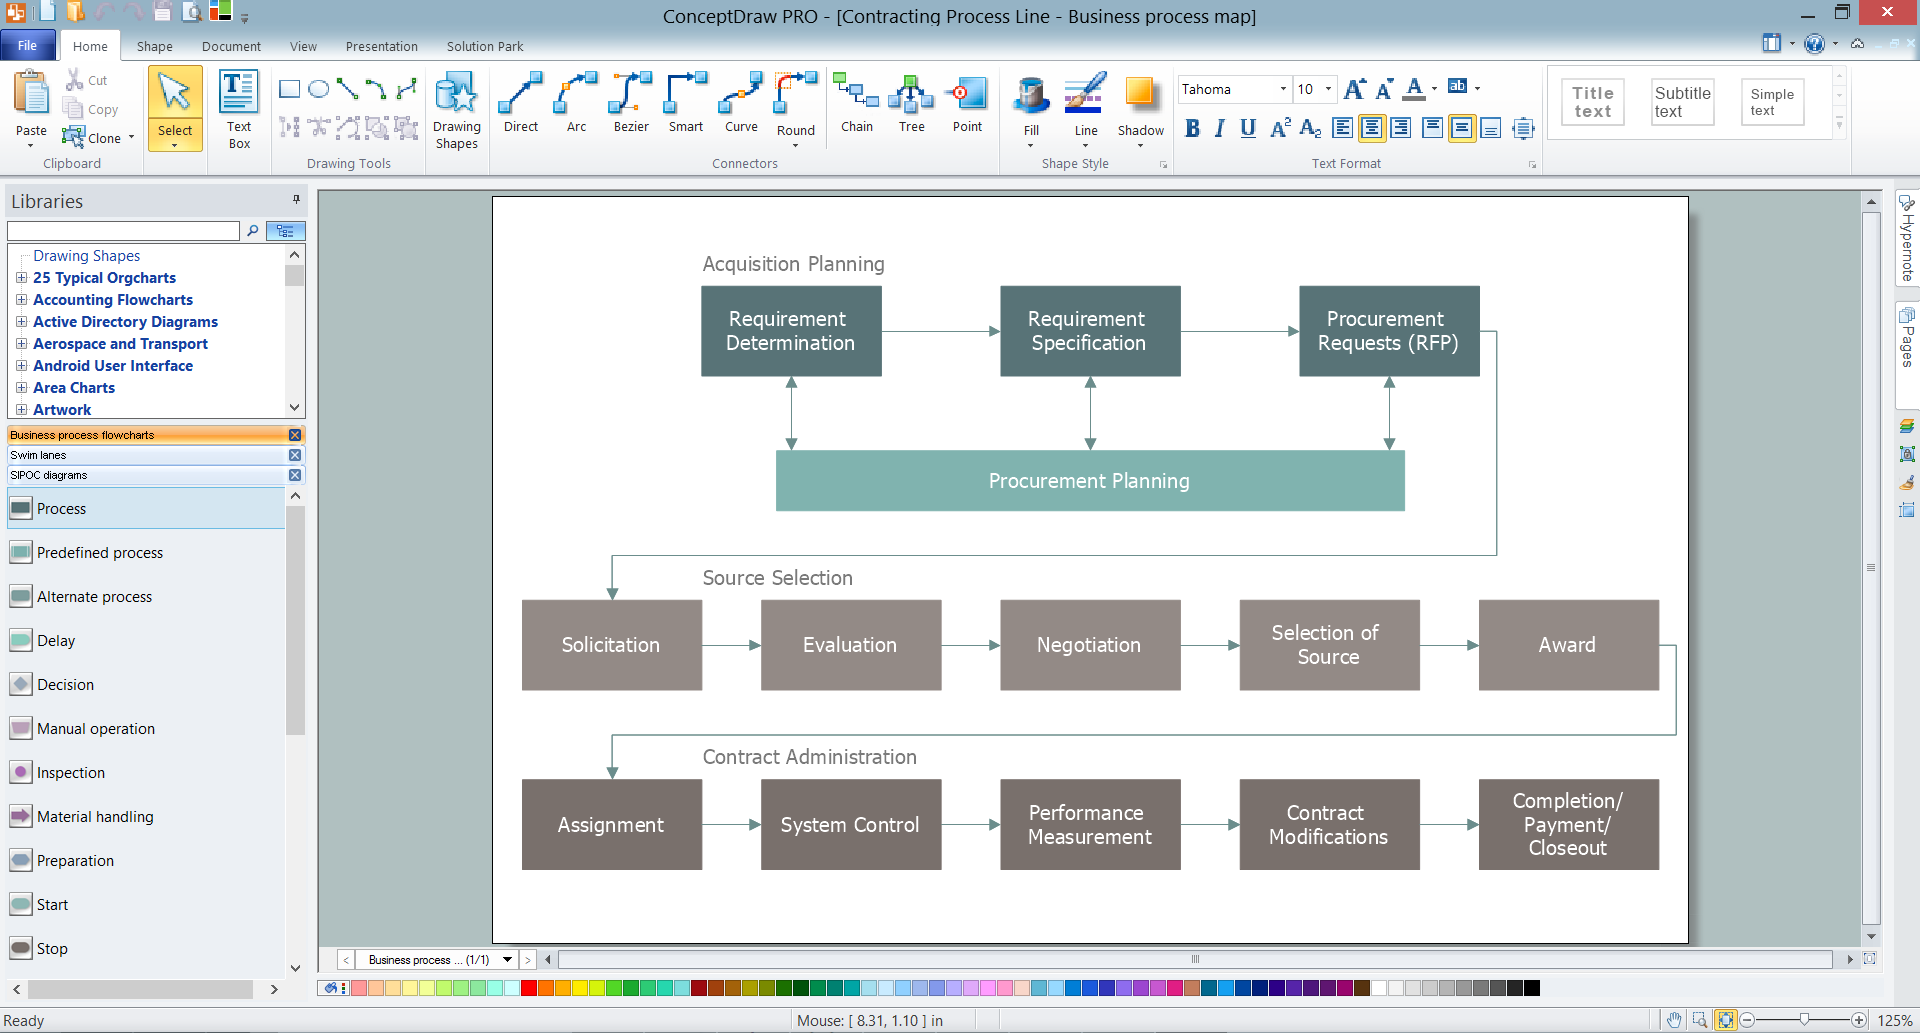
 Business Process Mapping
The Business Process Mapping solution for ConceptDraw DIAGRAM is for users involved in process mapping and creating SIPOC diagrams.
Business Process Flowchart Symbols

Business Mapping Software
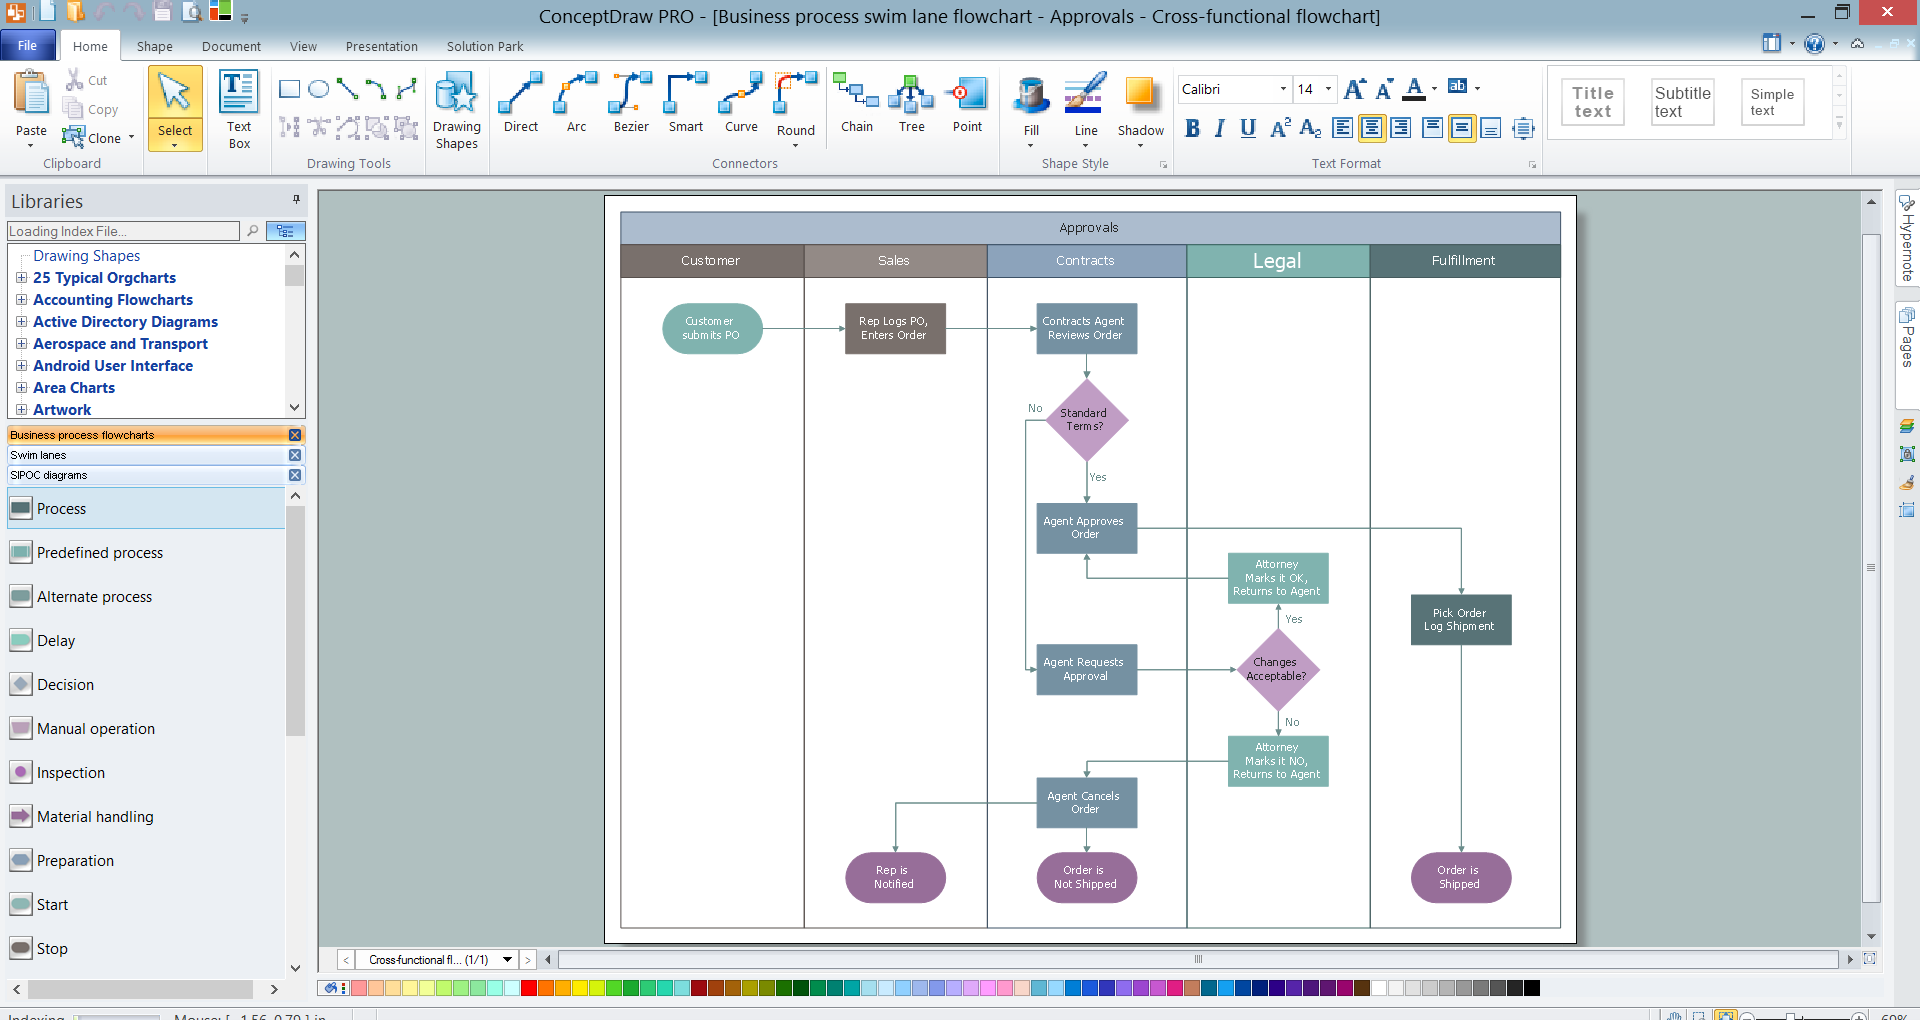
Swim Lanes
Process Mapping
Swim Lane Flowchart Symbols

Graphical Symbols to use in EPC diagrams

Flow Chart Symbols

Diagramming Software for Design UML Timing Diagrams


Business Process Mapping — How to Map a Work Process

 ConceptDraw Solution Park
ConceptDraw Solution Park collects graphic extensions, examples and learning materials
Work Order Process Flowchart. Business Process Mapping Examples

The Building Blocks Used in EPC Diagrams

- SIPOC Diagram | How to Create a SIPOC Diagram Using ...
- SIPOC Diagram | Business Process Mapping | Examples of ...
- Business Process Mapping | How to Create a SIPOC Diagram Using
- How to Create a SIPOC Diagram Using ConceptDraw PRO | TQM ...
- Process Flowchart | Process Improvement | SIPOC Diagram ...
- SIPOC Diagram | Building Drawing Design Element: Machines and ...
- Types of Flowcharts | SIPOC Diagram | Business Process Mapping ...
- Process Flowchart | Process Flow Chart | SIPOC Diagram | Process ...
- Flow chart Example. Warehouse Flowchart | SIPOC Diagram ...
- SIPOC Diagram | Cross-Functional Process Map Template | Block ...
- Types of Flowchart - Overview | SIPOC Diagram | Flowcharts | The ...
- Technical Flow Chart | How to Create a SIPOC Diagram Using ...
- Free Sipoc Diagram Template For Word Powerpoint Pdf
- ERD Symbols and Meanings | SIPOC Diagram | GUI Prototyping ...
- Erd Diagram Questions And Answers
- SIPOC Diagram | Basic Examples Of Copis
- Store Layout Software | Plant Design Solutions | SIPOC Diagram ...
- Input Process Output Diagram Example
- Basic Flowchart Symbols and Meaning | Process Flowchart | How to ...