Create Graphs and Charts

The Best Drawing Program for Mac

Basic Diagramming


Visual Presentations Made Easy with Diagramming Software


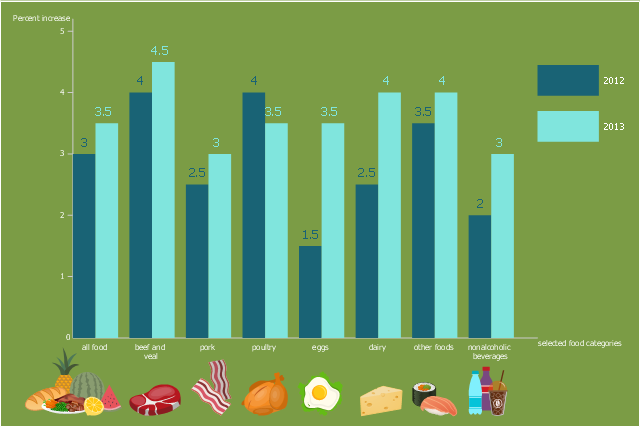
This double bar chart sample shows the forecasted impacts of 2012 drought expected to be larger in 2013 for most foods. It was designed in the base of the graph from the webpage "Price impacts of 2012 drought expected to be larger in 2013 for most foods" on the website of the United States Department of Agriculture Economic Research Service. [ers.usda.gov/ data-products/ chart-gallery/ detail.aspx?chartId=29456&ref=collection#.Ue5MMaxad5I]
"A price index (plural: “price indices” or “price indexes”) is a normalized average (typically a weighted average) of price relatives for a given class of goods or services in a given region, during a given interval of time. It is a statistic designed to help to compare how these price relatives, taken as a whole, differ between time periods or geographical locations.
Price indexes have several potential uses. For particularly broad indices, the index can be said to measure the economy's general price level or a cost of living. More narrow price indices can help producers with business plans and pricing. Sometimes, they can be useful in helping to guide investment." [Price index. Wikipedia]
The column chart example "Changes in price indices" was created using the ConceptDraw PRO diagramming and vector drawing software extended with the Bar Graphs solution from the Graphs and Charts area of ConceptDraw Solution Park.
Double bar graph
Basic Diagramming


 Bar Graphs
The Bar Graphs solution enhances ConceptDraw DIAGRAM functionality with templates, numerous professional-looking samples, and a library of vector stencils for drawing different types of Bar Graphs, such as Simple Bar Graph, Double Bar Graph, Divided Bar Graph, Horizontal Bar Graph, Vertical Bar Graph, and Column Bar Chart.
Basic Diagramming

Best Vector Drawing Application for Mac OS X

Basic Diagramming

Basic Diagramming

How To Create a Bubble Chart

Flowchart Example: Flow Chart of Marketing Analysis

 Pie Charts
Pie Charts are extensively used in statistics and business for explaining data and work results, in mass media for comparison (i.e. to visualize the percentage for the parts of one total), and in many other fields. The Pie Charts solution for ConceptDraw DIAGRAM offers powerful drawing tools, varied templates, samples, and a library of vector stencils for simple construction and design of Pie Charts, Donut Chart, and Pie Graph Worksheets.
 Area Charts
Area Charts are used to display the cumulative totals over time using numbers or percentages; or to show trends over time among related attributes. The Area Chart is effective when comparing two or more quantities. Each series of data is typically represented with a different color, the use of color transparency in an object’s transparency shows overlapped areas and smaller areas hidden behind larger areas.
- Create Graphs and Charts | Basic Diagramming | The Best Drawing ...
- Timeline Diagrams | Line Chart Examples | Line Graph Charting ...
- Applications | Create Graphs and Charts | Good Flow Chart app for ...
- Basic Diagramming | Flowchart Example : Flow Chart of Marketing ...
- Create Graphs and Charts | Cross-Functional Flowcharts | Process ...
- Pyramid Chart Examples | Concept map - Internet marketing ...
- Composition Dashboard | What is a Dashboard Area | Comparison ...
- Create Graphs and Charts | Pie Chart Examples | Good Flow Chart ...
- Best Program to Make Diagrams | Basic Diagramming | Visual ...
- Cross-Functional Flowcharts
- Create Graphs and Charts | Basic Diagramming | Line Graph ...
- Meter Dashboard | Composition Dashboard | Spatial Dashboard |
- Bar Chart Examples | Bar Chart Software | Bar Graphs |
- Sales Dashboard Template | Europe spatial dashboard template ...
- Picture Graphs | Picture graph template | Design elements - Picture ...
- Flowchart Example : Flow Chart of Marketing Analysis | Marketing ...
- Bar Chart Software | Bar Chart Examples | Bar Graphs |
- Picture graph template | Business and Finance Illustrations ...
- Spatial Dashboard | Spatial dashboard sample | Europe spatial ...
- Marketing | SWOT analysis Software & Template for Macintosh and ...