Road Transport - Design Elements
Brilliant Examples of Infographics Map, Transport, Road

 Maps
Maps
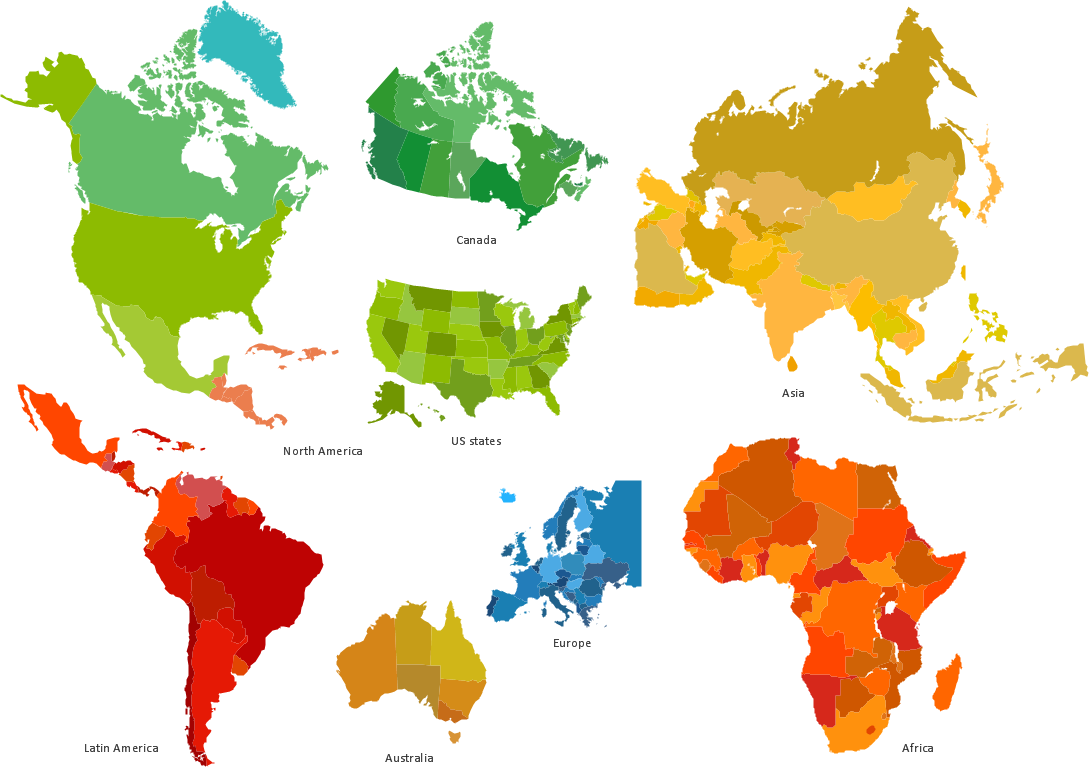
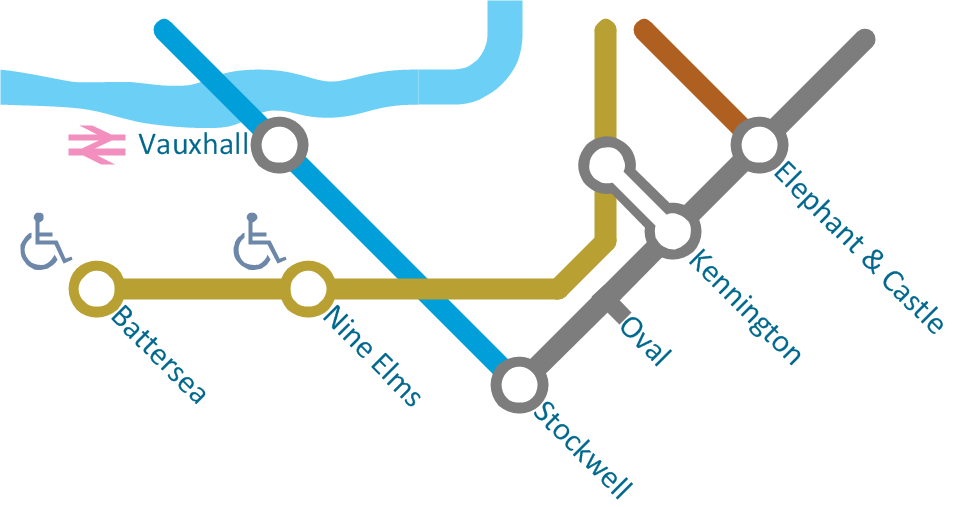
This solution extends ConceptDraw DIAGRAM.4 with the specific tools necessary to help you draw continental, directional, road, or transit maps, to represent international, business, or professional information visually.
Business diagrams & Org Charts with ConceptDraw DIAGRAM


Map Infographic Tool
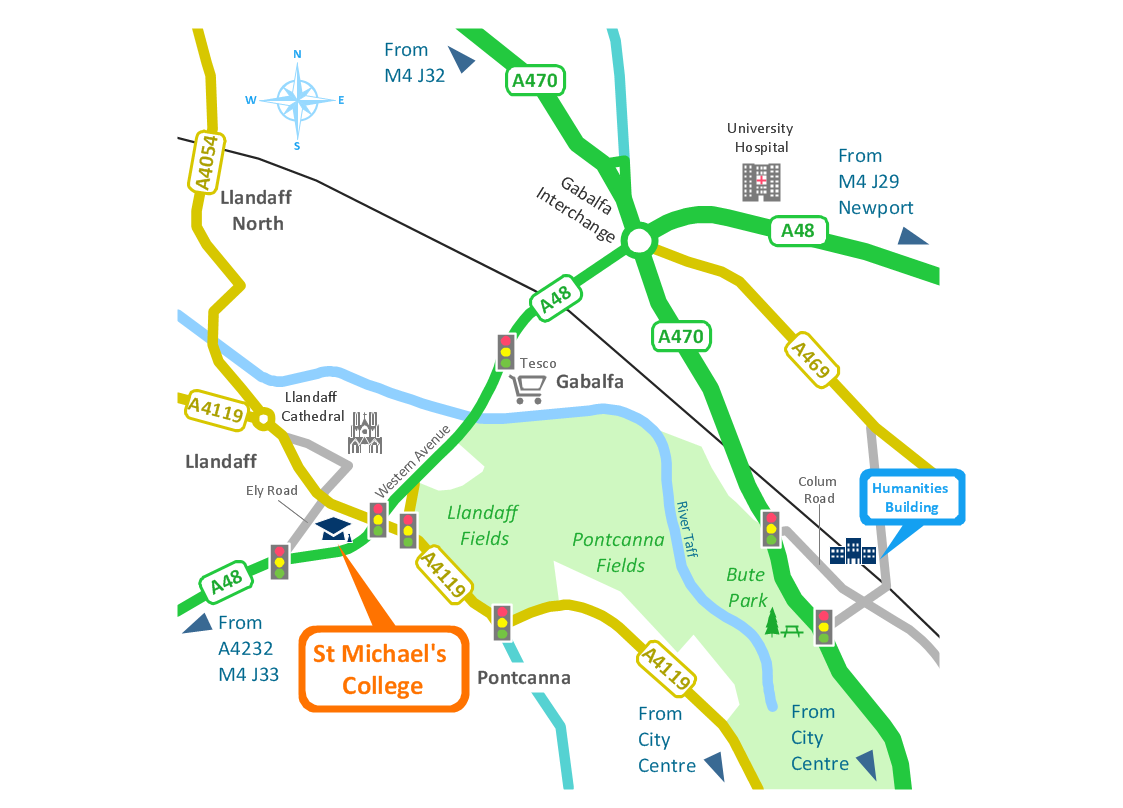
Spatial infographics Design Elements: Location Map
Best Tool for Infographic Construction

 Universal Diagramming Area
This area collects solutions for drawing diagrams, charts, graphs, matrices, geographic and road maps for education, science, engineering, business.
Types of Map - Overview
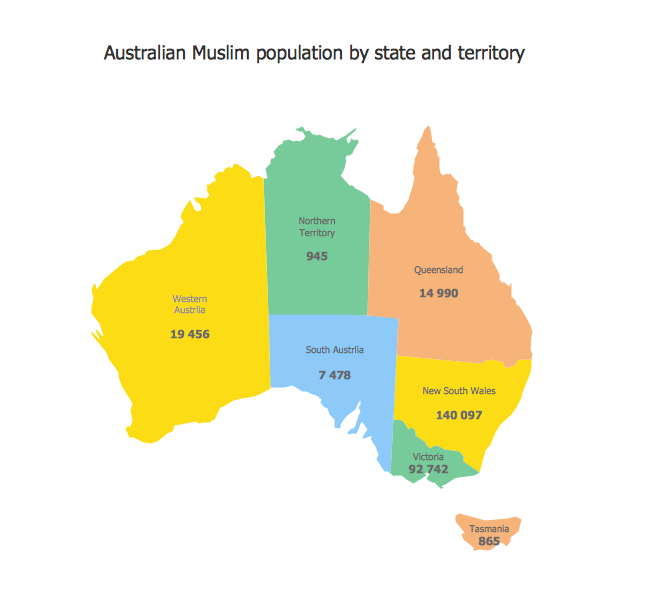
Map Infographic Design
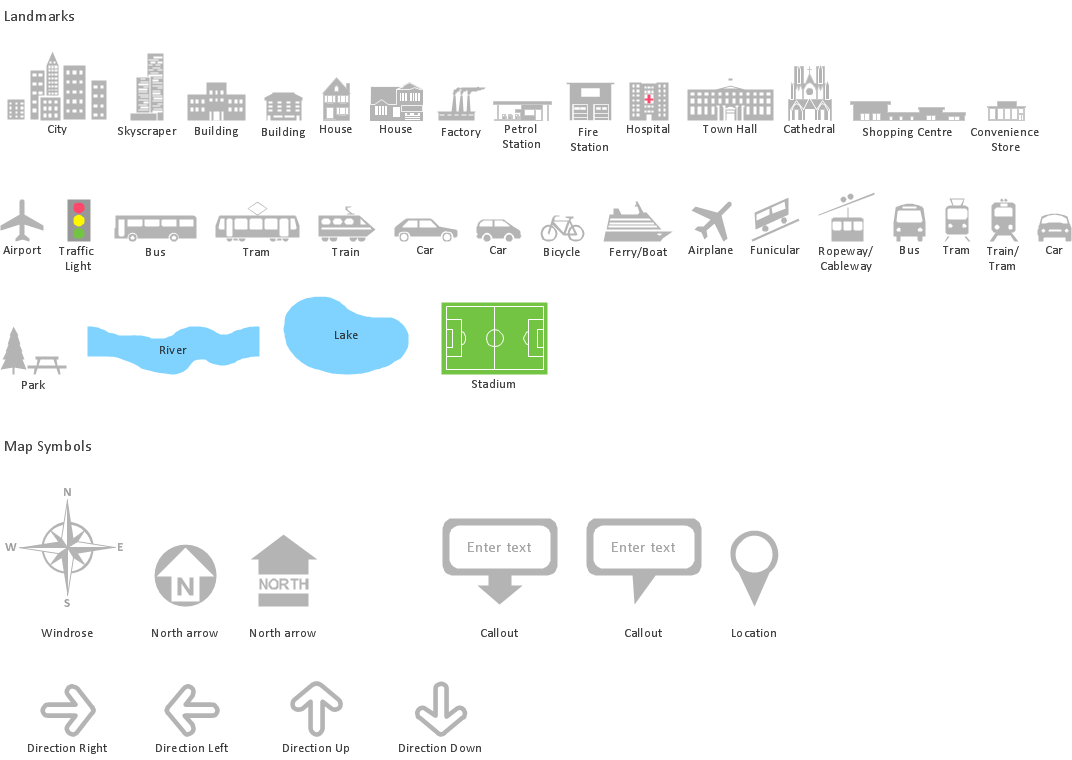
Tools to Create Your Own Infographics

Spatial Infographics

Tools for Creating Infographics and Visualizations
Infographics and Maps

- Maps | Map Infographic Creator | Brilliant Examples of Infographics ...
- Maps | Brilliant Examples of Infographics Map , Transport, Road ...
- ER Diagrams with ConceptDraw PRO | Road Transport - Design ...
- 3D Network Diagram Software
- 3D Network Diagram Software | Maps | Design elements - 3D ...
- Design elements - 3D directional maps | 3D directional map
- Design elements - Parking and roads | Building Drawing Software ...
- Road Transport - Design Elements | Visio Look a Like Diagrams ...
- 3D Network Diagram Software | Pyramid Diagram | Neighborhood ...
- ER Diagrams with ConceptDraw PRO | Aerospace and Transport ...
- Basic Diagramming | 3D Network Diagram Software | Maps |
- ConceptDraw Solution Park | Design elements - Parking and roads ...
- 3D directional map example | Directional map for the hotel ...
- 3D pictorial road map | 3D Directional map template | Design ...
- Road Transport - Design Elements | 3D Directional map template ...
- Maps | Metro Map | Spatial Infographics |
- Design elements - Road signs | Maps | Directional Maps |
- Road Transport - Design Elements | Design elements - Road signs ...
- Network Diagram Examples | Visio Look a Like Diagrams | Basic ...
- Road Transport - Design Elements | Aerospace and Transport ...