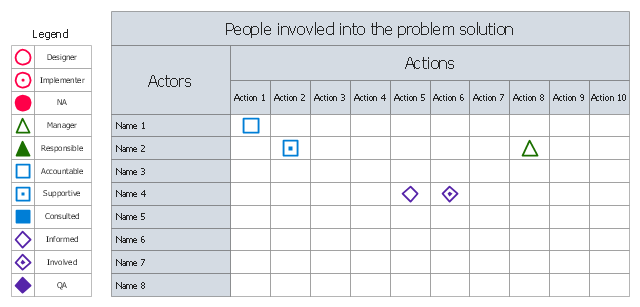
The involvement matrix (responsibility assignment matrix, RAM, RACI matrix, ARCI matrix, linear responsibility chart, LRC) defines the level of involvement and nature of participation . The diagram shows the degree of involvement for all identified parties in the execution of corrective actions.
"Key responsibility roles.
Responsible.
Those who do the work to achieve the task. There is at least one role with a participation type of responsible, although others can be delegated to assist in the work required (see also RASCI below for separately identifying those who participate in a supporting role).
Accountable (also approver or final approving authority).
The one ultimately answerable for the correct and thorough completion of the deliverable or task, and the one who delegates the work to those responsible. In other words, an accountable must sign off (approve) on work that responsible provides. There must be only one accountable specified for each task or deliverable.
Consulted (sometimes counsel).
Those whose opinions are sought, typically subject matter experts; and with whom there is two-way communication.
Informed.
Those who are kept up-to-date on progress, often only on completion of the task or deliverable; and with whom there is just one-way communication." [Responsibility assignment matrix. Wikipedia]
The involvement matrix is one of the Seven Management and Planning Tools (7 MP tools, Seven New Quality Tools).
The person involvement matrix template for the ConceptDraw PRO diagramming and vector drawing software is included in the solution "Seven Management and Planning Tools" from the Management area of ConceptDraw Solution Park.
Person involvement matrix
Cross-Functional Flowchart


HelpDesk
How To Create an Involvement Matrix

Process Flowchart


Internal Audit Process

Organizational Structure Total Quality Management

Types of Flowchart - Overview


Types of Flowcharts

Basic Audit Flowchart. Flowchart Examples

Organizational Chart Templates


Pie Chart Examples and Templates

Basic Flowchart Symbols and Meaning


Flowchart Software

Audit Process Flowchart. Audit Flowchart

Chart Audit

- Person involvement matrix - Template | Responsibility assignment ...
- Person involvement matrix - Template | Types of Flowcharts ...
- Responsibility assignment matrix - Central statistical office | Person ...
- Person involvement matrix - Template | Responsibility assignment ...
- Person involvement matrix - Template | How to Draw an ...
- Person involvement matrix - Template | A Responsibility Assignment ...
- Responsibility Assignment Matrix Template
- Roles And Responsibilities Matrix Template For It
- Person To Contact Matrix Template
- How To Create an Involvement Matrix | CORRECTIVE ACTIONS ...
- Responsibility Assignment Matrix Template Examples
- The Action Plan | Matrix Organization Structure | Responsibility ...
- Job Responsibilities Matrix Template
- Person involvement matrix - Template | CORRECTIVE ACTIONS ...
- Roles And Responsibilities Matrix Template Excel
- It Roles And Responsibilities Matrix Template
- Roles And Responsibilities Matrix Template
- Involvement matrix - Sale problem solution | Person involvement ...
- Person involvement matrix - Template | 3D Column chart - Iran ...
- Person involvement matrix - Template | Ansoff Matrix | Gant Chart in ...