The involvement matrix (responsibility assignment matrix, RAM, RACI matrix, ARCI matrix, linear responsibility chart, LRC) defines the level of involvement and nature of participation . The diagram shows the degree of involvement for all identified parties in the execution of corrective actions.
"Key responsibility roles.
Responsible.
Those who do the work to achieve the task. There is at least one role with a participation type of responsible, although others can be delegated to assist in the work required (see also RASCI below for separately identifying those who participate in a supporting role).
Accountable (also approver or final approving authority).
The one ultimately answerable for the correct and thorough completion of the deliverable or task, and the one who delegates the work to those responsible. In other words, an accountable must sign off (approve) on work that responsible provides. There must be only one accountable specified for each task or deliverable.
Consulted (sometimes counsel).
Those whose opinions are sought, typically subject matter experts; and with whom there is two-way communication.
Informed.
Those who are kept up-to-date on progress, often only on completion of the task or deliverable; and with whom there is just one-way communication." [Responsibility assignment matrix. Wikipedia]
The involvement matrix is one of the Seven Management and Planning Tools (7 MP tools, Seven New Quality Tools).
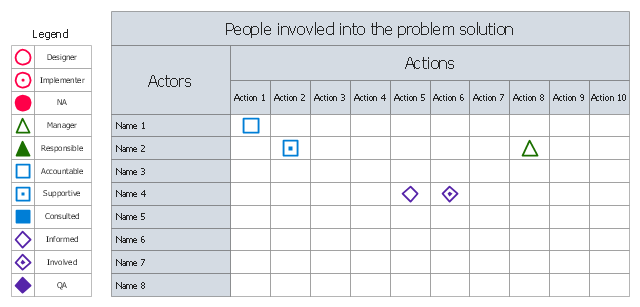
The person involvement matrix template for the ConceptDraw PRO diagramming and vector drawing software is included in the solution "Seven Management and Planning Tools" from the Management area of ConceptDraw Solution Park.
"Key responsibility roles.
Responsible.
Those who do the work to achieve the task. There is at least one role with a participation type of responsible, although others can be delegated to assist in the work required (see also RASCI below for separately identifying those who participate in a supporting role).
Accountable (also approver or final approving authority).
The one ultimately answerable for the correct and thorough completion of the deliverable or task, and the one who delegates the work to those responsible. In other words, an accountable must sign off (approve) on work that responsible provides. There must be only one accountable specified for each task or deliverable.
Consulted (sometimes counsel).
Those whose opinions are sought, typically subject matter experts; and with whom there is two-way communication.
Informed.
Those who are kept up-to-date on progress, often only on completion of the task or deliverable; and with whom there is just one-way communication." [Responsibility assignment matrix. Wikipedia]
The involvement matrix is one of the Seven Management and Planning Tools (7 MP tools, Seven New Quality Tools).
The person involvement matrix template for the ConceptDraw PRO diagramming and vector drawing software is included in the solution "Seven Management and Planning Tools" from the Management area of ConceptDraw Solution Park.
Person involvement matrix
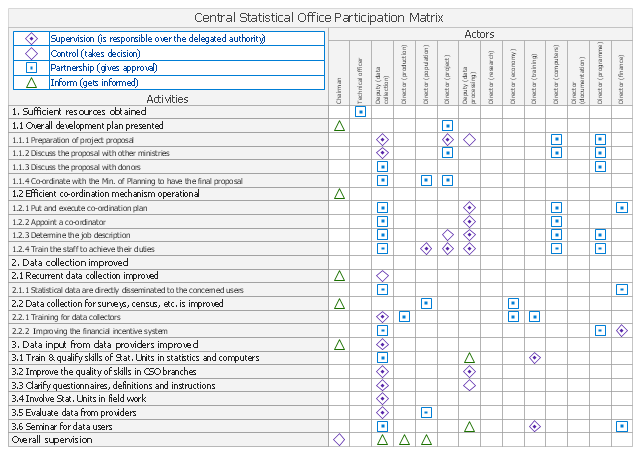
"A responsibility assignment matrix (RAM), also known as RACI matrix or ARCI matrix or linear responsibility chart (LRC), describes the participation by various roles in completing tasks or deliverables for a project or business process. It is especially useful in clarifying roles and responsibilities in cross-functional/ departmental projects and processes.
RACI and ARCI are acronyms derived from the four key responsibilities most typically used: Responsible, Accountable, Consulted, and Informed. ...
The matrix is typically created with a vertical axis (left-hand column) of tasks (e.g., from a work breakdown structure WBS) or deliverables (e.g., from a product breakdown structure PBS), and a horizontal axis (top row) of roles (e.g., from an organizational chart)" [Responsibility assignment matrix. Wikipedia]
The responsibility assignment matrix example "Central statistical office" was created using the ConceptDraw PRO diagramming and vector drawing software extended with the solution "Seven Management and Planning Tools" from the Management area of ConceptDraw Solution Park.
Involvement matrix
Organizational Chart Templates


Process Flowchart


Flow chart Example. Warehouse Flowchart


Examples of Flowcharts, Org Charts and More


Flowchart Example: Flow Chart of Marketing Analysis

Flowchart Software


Horizontal Flowchart

Types of Flowcharts


- Linear Responsibility Chart
- Army Flow Charts | Responsibility Flow Chart Template
- Person involvement matrix - Template | Responsibility assignment ...
- Person involvement matrix - Template | Authority Matrix Diagram ...
- Person involvement matrix - Template | Chore charts with ...
- Authority Matrix Diagram Software | CORRECTIVE ACTIONS ...
- Person involvement matrix - Template | How to Draw an ...
- Responsibility assignment matrix - Central statistical office ...
- Person involvement matrix - Template | 25 Typical Orgcharts ...