Seven Basic Tools of Quality - Histogram
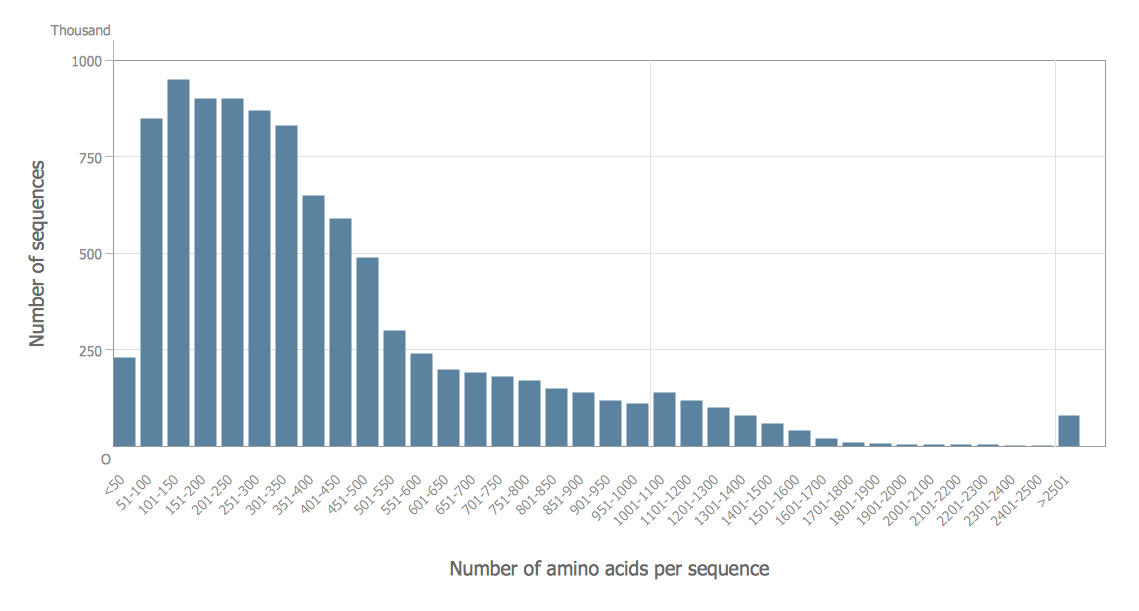
A histogram is a chart which visually displays a distribution of numerical data. ConceptDraw PRO diagramming and vector drawing software offers a powerful Seven Basic Tools of Quality solution from the Quality area of ConceptDraw Solution Park which contains a set of useful tools for easy drawing Histogram and other quality related diagrams of any complexity.Seven Basic Tools of Quality - Quality Control
ConceptDraw PRO diagramming and vector drawing software extended with Seven Basic Tools of Quality solution from the Quality area of ConceptDraw Solution Park provides effective tools for quality control and helps design any types of quality-related diagrams.Seven Basic Tools of Quality - Fishbone Diagram
ConceptDraw PRO enhanced with Seven Basic Tools of Quality solution from the Quality area of ConceptDraw Solution Park is an ideal software for fast and easy drawing professional looking quality diagrams, including a Fishbone diagram.
 Seven Basic Tools of Quality
Manage quality control in the workplace, using fishbone diagrams, flowcharts, Pareto charts and histograms, provided by the Seven Basic Tools of Quality solution.
Histogram Chart
What is a Histogram Chart? It is a chart which visually displays a distribution of the data. ConceptDraw PRO extended with Histograms solution from the Graphs and Charts area of ConceptDraw Solution Park is the best software for fast and simple drawing professional looking Histogram Chart.Make a Histogram
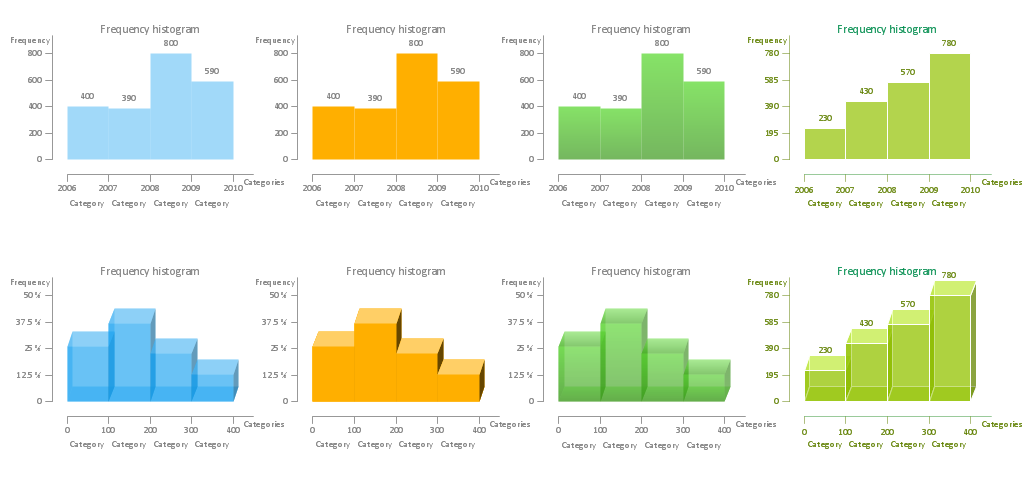
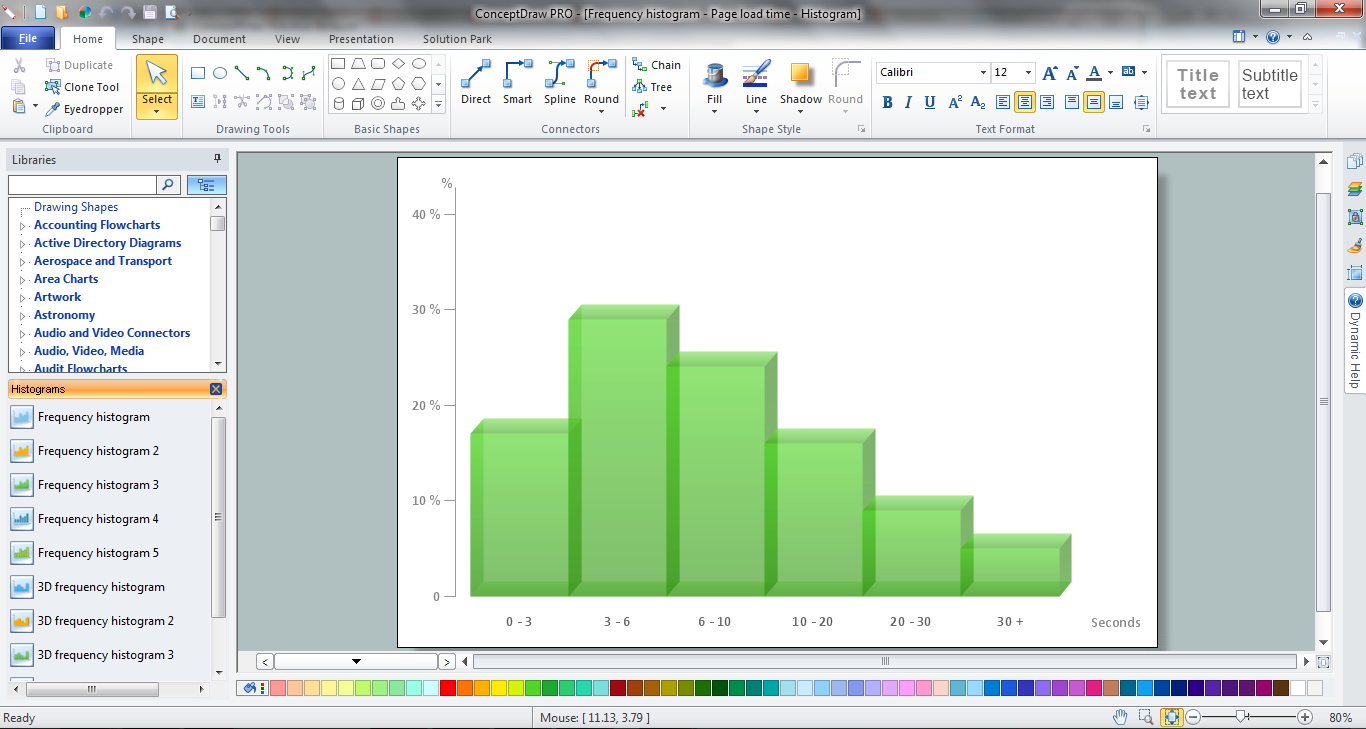
ConceptDraw PRO extended with Histograms solution from the Graphs and Charts area of ConceptDraw Solution Park lets you make a Histogram of any complexity in minutes.Histogram
ConceptDraw PRO diagramming and vector drawing software offers the Histograms solution from the Graphs and Charts area of ConceptDraw Solution Park with powerful tools to help you draw a Histogram of any complexity quick and easy.
 Fishbone Diagrams
The Fishbone Diagrams solution extends ConceptDraw PRO v10 software with the ability to easily draw the Fishbone Diagrams (Ishikawa Diagrams) to clearly see the cause and effect analysis and also problem solving. The vector graphic diagrams produced using this solution can be used in whitepapers, presentations, datasheets, posters, and published technical material.
Competitor Analysis
Competitor analysis is a first and obligatory step in elaboration the proper corporate marketing strategy and creating sustainable competitive advantage. Use powerful opportunities of numerous solutions from ConceptDraw Solution Park for designing illustrative diagrams, charts, matrices which are necessary for effective competitor analysis.Visual Presentations Made Easy with Diagramming Software
Automatically create a presentation-quality diagram in one click with ConceptDraw PRO.
Chart Examples
Easy charting software comes with beautiful chart templates and examples. This makes it easy to create professional charts without prior experience.
 Total Quality Management TQM Diagrams
Total Quality Management Diagrams solution extends ConceptDraw PRO software with samples, templates and vector stencils library for drawing the TQM flowcharts.
 Business Package for Management
Package intended for professional who designing and documenting business processes, preparing business reports, plan projects and manage projects, manage organizational changes, prepare operational instructions, supervising specific department of an organization, workout customer service processes and prepare trainings for customer service personal, carry out a variety of duties to organize business workflow.
Line Chart Examples
The Line Graphs solution from Graphs and Charts area of ConceptDraw Solution Park contains a set of examples, templates and design elements library of line and scatter charts. Use it to draw line and scatter graphs using ConceptDraw PRO diagramming and vector drawing software for illustrating your documents, presentations and websites.- Example Of Histogram In Quality Control
- 7 Tools For Quality Example
- Example For Draw The Histodiagram In Quality Control
- Seven Basic Tools of Quality - Histogram | Histogram | How Do You ...
- Seven Basic Tools of Quality - Histogram | Quality Management ...
- How To Make Histogram Qc
- Design elements - Histogram
- Seven Basic Tools of Quality - Quality Control | Histogram 7qc With ...
- Use Of Histogram In Quality Control
- Seven Basic Tools of Quality - Histogram | Histograms | Basic ...
- Seven Basic Tools of Quality - Histogram | Histograms | Making a ...
- Histogram In Quality Management
- Seven Basic Tools of Quality | Histograms | Basic Histograms ...
- Seven Basic Tools of Quality - Histogram | How Do You Make a ...
- Seven Basic Tools of Quality - Histogram | Histogram example - Age ...
- Probability Quality Control Tools | Process Flowchart | Histograms ...
- Histogram | Seven Basic Tools of Quality - Flow Chart | Seven Basic ...
- Scatter Diagrams | Seven Basic Tools of Quality - Quality Control ...
- Examples of Flowcharts, Org Charts and More | Histograms | Seven ...
- Basic 7 Qc Tools With Examples


