How to Create a Social Media DFD Flowchart

It allows companies to be more effective in timely messaging thanks to the ability for rapid response to a customer′s post in social media. This saves budget for companies who use social media for promoting and as a lead generation tool.
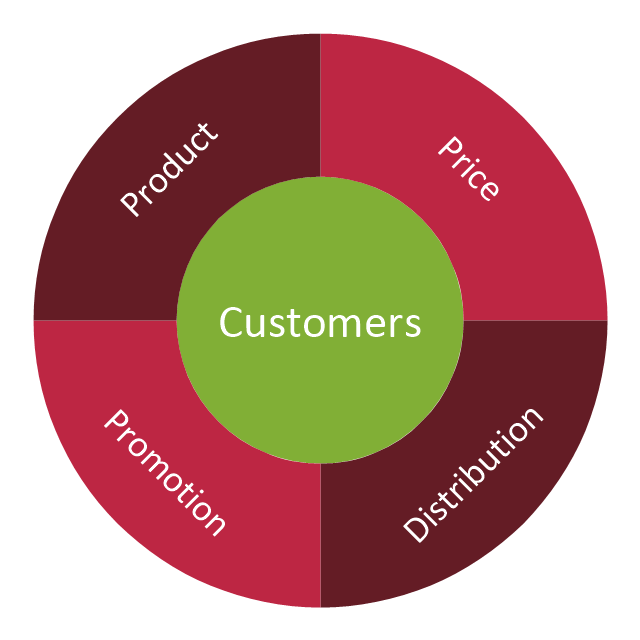
 Circle-Spoke Diagrams
Examples of subject areas that are well suited to this approach are marketing, business, products promotion, process modeling, market, resource, time, and cost analysis. Circle-Spoke Diagrams are successfully used in presentations, conferences, management documents, magazines, reportages, reviews, reports, TV, and social media.
"The marketing mix is a business tool used in marketing and by marketing professionals. The marketing mix is often crucial when determining a product or brand's offer, and is often synonymous with the four Ps: price, product, promotion, and place ..." [Marketing mix. Wikipedia]
The example of wheel diagram (ring diagram, bevel style circle diagram, circular diagram) "Marketing mix" was created using the ConceptDraw PRO diagramming and vector drawing software extended with the Target and Circular Diagrams solution from the Marketing area of ConceptDraw Solution Park.
www.conceptdraw.com/ solution-park/ marketing-target-and-circular-diagrams
Marketing mix - Wheel diagram
Draw Flowcharts with ConceptDraw

"Causes in the diagram are often categorized, such as to ...
The 7 Ps (used in marketing industry):
(1) Product/ Service;
(2) Price;
(3) Place;
(4) Promotion;
(5) People/ personnel;
(6) Positioning;
(7) Packaging. " [Ishikawa diagram. Wikipedia]
This 8 Ps Ishikawa diagram (service cause and effect diagram) template is included in the Fishbone Diagram solution from the Management area of ConceptDraw Solution Park.
8Ps fishbone diagram

Flow chart Example. Warehouse Flowchart

Standard warehousing process flow diagram and standard workflow diagram used for process identification for further evaluating effectiveness and profitability of overall business process. Use the ConceptDraw PRO diagramming and vector drawing software extended with the Flowcharts solution from the Diagrams area of ConceptDraw Solution Park to design your own workflow diagrams, process flow diagram and flow charts. Need to use Process Flow Diagram for designing Warehouse packages flow.

Entity Relationship Diagram - ERD - Software for Design Crows Foot ER Diagrams
_Win_Mac.png "Entity Relationship Diagram Software, Design Elements - Crows Foot (Windows, Macintosh)")

Use the Best FlowChart Tool for the Job

How to Use the ″Online Store PR Campaign″ Sample

HelpDesk
How to Design an Interface Mockup for iPhone Application in ConceptDraw PRO

This circle-spoke diagram sample illustrates the target market concept.
"A target market is a group of customers towards which a business has decided to aim its marketing efforts and ultimately its merchandise. A well-defined target market is the first element to a marketing strategy. The marketing mix variables of product, place (distribution), promotion and price are the four elements of a marketing mix strategy that determine the success of a product in the marketplace." [Target market. Wikipedia]
The hub-and-spoke diagram example "Target market" was created using the ConceptDraw PRO diagramming and vector drawing software extended with the Circle-Spoke Diagrams solution from the area "What is a Diagram" of ConceptDraw Solution Park.
Circle-spoke diagram

Create Process Flowcharts

How to Present a Social Media Response Plan DFD to Your Team

Organizing and Selecting Social Media Response Action

- Marketing Diagrams | Competitor Analysis | Marketing mix - Wheel ...
- Marketing mix - Wheel diagram | Marketing Diagrams | Service ...
- Marketing mix - Wheel diagram | Target market | Competitor Analysis ...
- Marketing mix - Wheel diagram | Marketing Diagrams | Target ...
- Diagram On Promotion Mix
- Marketing Diagrams | Six Elements Of Promotion Mix Diagram
- Marketing Diagrams | Competitor Analysis | Six Elements Of ...
- Marketing mix - Wheel diagram | Marketing Diagrams | Promotion ...
- Marketing Diagrams | Illustration Diagram For Promotion Mix For ...
- Marketing Diagrams | Promotion Mix Chart
- Marketing Diagrams | Diagram Of Promotion Mix
- Marketing Diagrams | Promotion Mix Process Diagram
- Marketing Diagrams | Promotion Mix Chart Or Graph
- Marketing Diagrams | Gym and Spa Area Plans | Customer ...
- Diagrams For Promotion
- Marketing Diagrams | Daigram Of Sale Promotion And Marketing Mix
- Swimlane Diagram Of Business Promotion Process
- Marketing mix - Wheel diagram | Target diagrams - Vector stencils ...
- Marketing mix - Wheel diagram | Target market | Use of social media ...
- Advertising And Promotion Workflow Diagram
- ERD | Entity Relationship Diagrams, ERD Software for Mac and Win
- Flowchart | Basic Flowchart Symbols and Meaning
- Flowchart | Flowchart Design - Symbols, Shapes, Stencils and Icons
- Flowchart | Flow Chart Symbols
- Electrical | Electrical Drawing - Wiring and Circuits Schematics
- Flowchart | Common Flowchart Symbols
- Flowchart | Common Flowchart Symbols