Probability Quality Control Tools

Definition TQM Diagram

Quality Control Chart Software — ISO Flowcharting

The quality control chart is a graphic that illustrates the accordance of processes or products to the intended specifications and degree of differences from them. Depending on what type of data you need analyze, there are used different types of quality control charts: X-bar charts, S charts, Np charts.
Social Media Response Management DFD Charts - software tools


Total Quality Management Definition

Total Quality Management

Affinity Diagram

How to Make an Accounting Process Flowchart

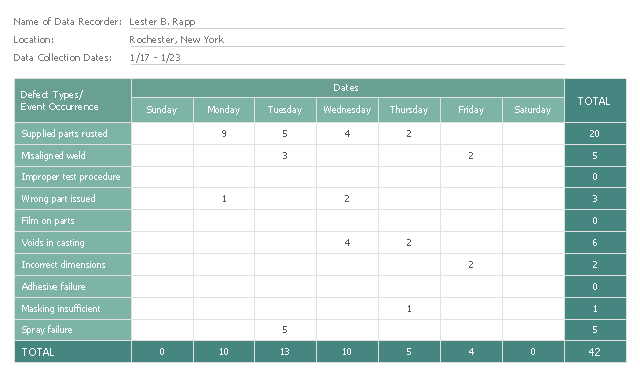
This check sheet example was redesigned from the Wikimedia Commons file: Check sheet for motor assembly.svg. [commons.wikimedia.org/ wiki/ File:Check_ sheet_ for_ motor_ assembly.svg]
This file is licensed under the Creative Commons Attribution-Share Alike 3.0 Unported license. [creativecommons.org/ licenses/ by-sa/ 3.0/ deed.en]
"The check sheet is a form (document) used to collect data in real time at the location where the data is generated. The data it captures can be quantitative or qualitative. When the information is quantitative, the check sheet is sometimes called a tally sheet.
The check sheet is one of the so-called Seven Basic Tools of Quality Control. ...
Kaoru Ishikawa identified five uses for check sheets in quality control:
- To check the shape of the probability distribution of a process
- To quantify defects by type
- To quantify defects by location
- To quantify defects by cause (machine, worker)
- To keep track of the completion of steps in a multistep procedure (in other words, as a checklist)" [. Wikipedia]
The example "Check sheet for motor assembly" was created using the ConceptDraw PRO software extended with the Seven Basic Tools of Quality solution from the Quality area of ConceptDraw Solution Park.
Check sheet example
Used Solutions
Quality
>
Venn Diagram Template for Word

Venn Diagram Examples for Problem Solving . Quantum Information Science. BQP Complexity

Venn Diagram Examples for Problem Solving. Environmental Social Science. Human Sustainability Confluence

Create your Venn diagrams for problem solving in environmental social science using the ConceptDraw PRO diagramming and vector drawing software extended with the Venn Diagrams solution from the area "What is a Diagram" of ConceptDraw Solution Park.
Venn Diagram Examples for Problem Solving. Venn Diagram as a Truth Table

Circles Venn Diagram

3 Circle Venn. Venn Diagram Example

- Total Quality Management Value | Probability Quality Control Tools ...
- TQM Diagram Example | Probability Quality Control Tools | TQM ...
- Probability Quality Control Tools | Check sheet for motor assembly ...
- Quality Control Chart Software — ISO Flowcharting | Probability ...
- Total Quality Management Definition | TQM Diagram Example ...
- Process Flowchart | Probability Quality Control Tools | TQM Diagram ...
- Probability Quality Control Tools | TQM Diagram Tool | Total Quality ...
- Probability Quality Control Tools | TQM Diagram Tool | Management ...
- Probability Quality Control Tools | TQM Diagram Tool | TQM ...
- Probability Quality Control Tools | How to Create a Venn Diagram in ...
- Total Quality Management TQM Diagrams | Probability Quality ...
- Total Quality Management TQM Diagrams | Probability Quality ...
- Probability Quality Control Tools | Total Quality Management TQM ...
- Probability Quality Control Tools | Quality Control | Organizational ...
- Probability Quality Control Tools | Process Flowchart | Quality ...
- Total Quality Management Value | Probability Quality Control Tools ...
- Process Flowchart | Probability Quality Control Tools | Quality ...
- TQM Diagram Tool | Seven Basic Tools of Quality - Quality Control ...
- Process Flowchart | TQM Diagram Example | Probability Quality ...
- Process Flowchart | Probability Quality Control Tools | TQM Diagram ...