Probability Quality Control Tools

TQM Software — Build Professional TQM Diagrams

TQM Diagram Example

Quality Management System

House of Quality Matrix Software

TQM Tools

Context Diagram Template

This template shows the Context Diagram. It was created in ConceptDraw PRO diagramming and vector drawing software using the Block Diagrams Solution from the “What is a Diagram” area of ConceptDraw Solution Park. The context diagram graphically identifies the system. external factors, and relations between them. It’s a high level view of the system. The context diagrams are widely used in software engineering and systems engineering for designing the systems that process the information.
PROBLEM ANALYSIS. Root Cause Analysis Tree Diagram


Stakeholder Onion Diagrams

Purchase Process Flow Chart, Receiving Process Flow Chart, Accounting Flowchart Example.
")
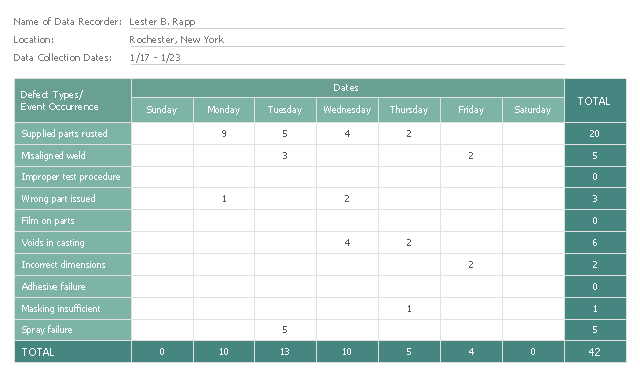
This check sheet example was redesigned from the Wikimedia Commons file: Check sheet for motor assembly.svg. [commons.wikimedia.org/ wiki/ File:Check_ sheet_ for_ motor_ assembly.svg]
This file is licensed under the Creative Commons Attribution-Share Alike 3.0 Unported license. [creativecommons.org/ licenses/ by-sa/ 3.0/ deed.en]
"The check sheet is a form (document) used to collect data in real time at the location where the data is generated. The data it captures can be quantitative or qualitative. When the information is quantitative, the check sheet is sometimes called a tally sheet.
The check sheet is one of the so-called Seven Basic Tools of Quality Control. ...
Kaoru Ishikawa identified five uses for check sheets in quality control:
- To check the shape of the probability distribution of a process
- To quantify defects by type
- To quantify defects by location
- To quantify defects by cause (machine, worker)
- To keep track of the completion of steps in a multistep procedure (in other words, as a checklist)" [. Wikipedia]
The example "Check sheet for motor assembly" was created using the ConceptDraw PRO software extended with the Seven Basic Tools of Quality solution from the Quality area of ConceptDraw Solution Park.
Check sheet example
Used Solutions
Quality
>
Network Hubs


Network Diagram Software Topology Network

Making a Histogram

How To use Switches in Network Diagram

- Total Quality Management Value | Probability Quality Control Tools ...
- Probability Quality Control Tools | Management Tools — Total ...
- Probability Quality Control Tools | Total Quality Management Value ...
- Probability Quality Control Tools | TQM Diagram Example | Quality ...
- TQM Diagram Example | Process Flowchart | Probability Quality ...
- Process Flowchart | Probability Quality Control Tools | What is a ...
- Probability Quality Control Tools | Definition TQM Diagram | Quality ...
- Total Quality Management Value | Seven Basic Tools of Quality ...
- Probability Quality Control Tools | Process Flowchart | TQM Diagram ...
- Process Flowchart | Total Quality Management Definition ...
- Seven Management and Planning Tools | Probability Quality Control ...
- Probability Quality Control Tools | Basic Flowchart Symbols and ...
- Probability Quality Control Tools | Definition TQM Diagram | Process ...
- TQM Diagram Example | Probability Quality Control Tools | TQM ...
- Probability Quality Control Tools | Prioritization matrix - Health care ...
- Probability Quality Control Tools | SWOT Analysis Solution - Strategy ...
- Definition TQM Diagram | Probability Quality Control Tools ...
- Quality Control Chart Software — ISO Flowcharting | Probability ...
- TQM Diagram Example | Definition TQM Diagram | Probability ...