HelpDesk
How to Track Your Project Plan vs. the Actual Project Condition
Conceptdraw PROJECT provides user with the possibility to track how the project is going. Project Manager can compare the actual data with the planned and assess possible measures to resolve issues. Conceptdraw PROJECT has several types of visual reports that can help to assess visually the difference between planned and actual project data.HelpDesk
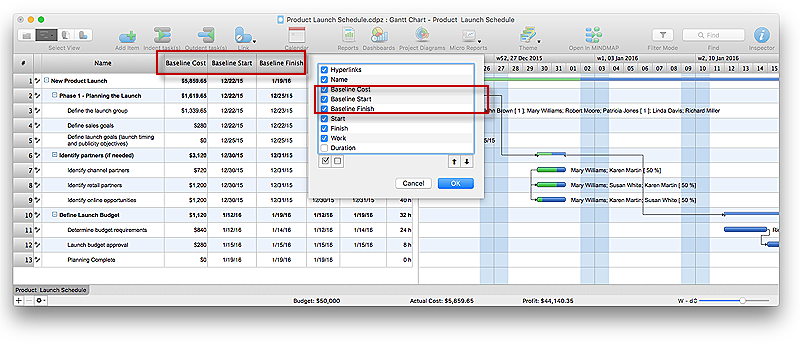
How to Set a Project Baseline Using ConceptDraw PROJECT
Project baseline in ConceptDraw PROJECT is excellent forguiding the execution of the current project and can be useful for further projects.HelpDesk
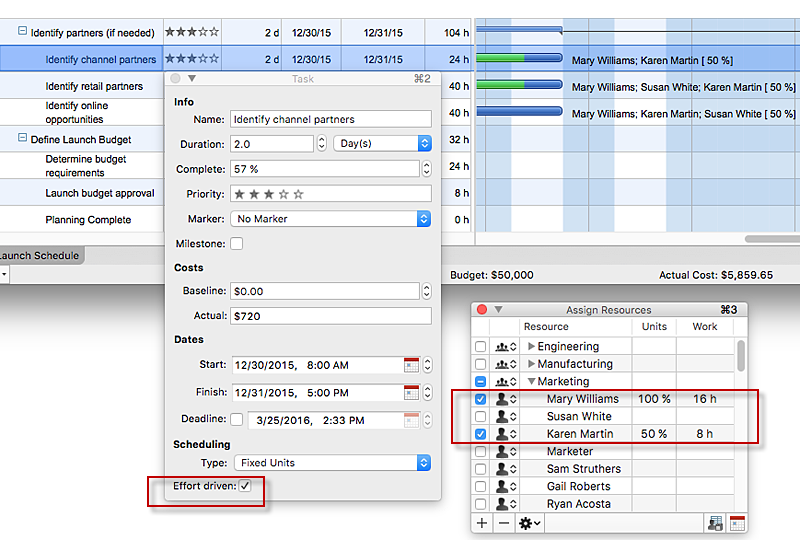
How to Use the Effort-Driven Scheduling Method
Effort-driven scheduling is the default method of project scheduling in ConceptDraw PROJECT.HelpDesk
How to Operate with Project Time Frames in ConceptDraw PROJECT
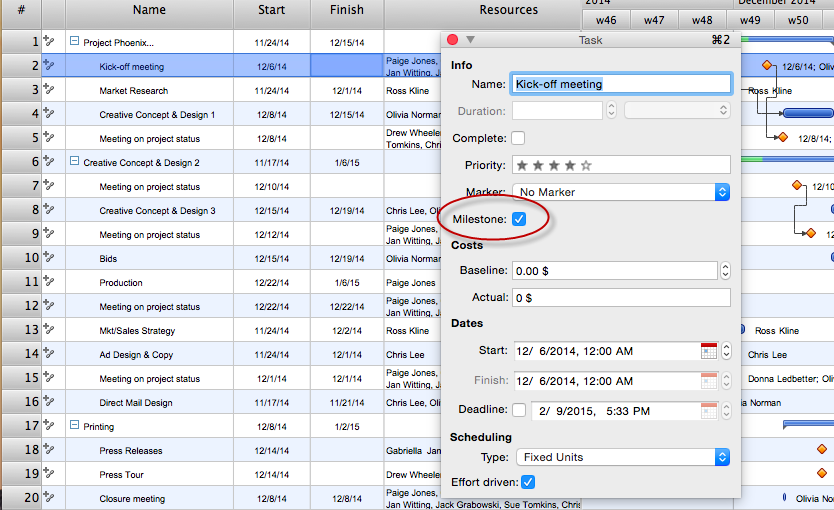
ConceptDraw PROJECT applies an advanced scheduling facilities to enable you arrange your project's tasks with existing human and material resources. Comprehension of project scheduling principle allows you to plan the project the best way to execute it. Sometimes user is wondering why the task is moved to a different time than he supposed. Or he may be confused when a task's tardiness provoke the unwanted shift of other tasks. This article describes how do changes to the Start/Finish dates, or the Duration of the task affect the project schedule, created in ConceptDraw PROJECT.HelpDesk
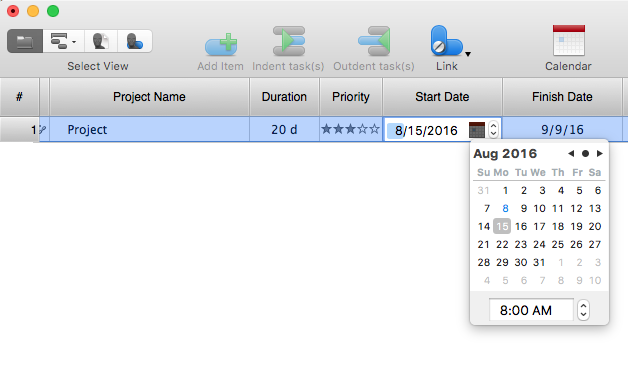
How to Customize a Task’s Duration
When you create an automatically scheduled task, ConceptDraw PROJECT assigns it duration of one day by default. You need modify that duration to reflect the real amount of time that the task requires.How To use House Electrical Plan Software
How we can conduct the electricity at house correctly without a plan? It is impossible. The House electrical diagram depicts locations of switches, outlets, dimmers and lights, and lets understand how you will connect them. But design of House Electrical Plan looks a complex task at a glance, which requires a lot of tools and special experience. But now all is simple with all-inclusive floor plan software - ConceptDraw PRO. As a house electrical plan software, the ConceptDraw PRO contains libraries with a large range of professional lighting and electrical symbols, ready-to-use electrical plans samples and examples, and built-in templates for creating great-looking Home floor electrical plans. It is a fastest way to draw Electrical circuit diagrams, Electrical wiring and Circuit schematics, Digital circuits, Electrical equipment, House electrical plans, Satellite television, Cable television, Home cinema, Closed-circuit television when are used the tools of Electric and Telecom Plans Solution from ConceptDraw Solution Park. Files created in Visio for Mac app can be easily imported to ConceptDraw PRO. Also you may import stencils and even libraries. Try for free an alternative to Visio that Apple users recommend.
How To Draw Building Plans
Building Plan is the basis for implementation construction and repair works. Creation of Building Plans is the main purpose of architects and designers. They are required and even obligatory for builders to accurately implement your wishes and ideas during the building, designing or redesigning your home, flat, office, or any other premise. ConceptDraw PRO is a powerful quick building plan software for creating great-looking Office layouts, Home floor plans, Commercial floor plans, Storage building plans, Expo and Shopping mall building plans, School and Training building plans, Cafe or Restaurant plans, Gym and Spa area plans, Sport field plans, House interior designs, Electric and Telecom building plans, Fire and Emergency plans, HVAC plans, Security and Access plans, Plumbing and Piping plans, Plant layouts, etc. Use helpful samples, templates and variety of libraries with numerous building design elements from Floor Plans solution for ConceptDraw PRO software to facilitate design drawing process.
 PM Dashboards
The PM Dashboards solution extends the management boundaries of ConceptDraw PRO and ConceptDraw PROJECT products with an ability to demonstrate changes to the budget status, to show the project progress toward its objectives, to display clearly the identified key performance indicator (KPI) or the set of key performance indicators for any project. This solution provides you with examples and ability to generate three types of visual dashboards reports based on your project data Project Dashboard, Tactical Dashboard, and Radar Chart. By dynamically charting the project’s key performance indicators that are collected on one ConceptDraw PRO document page, all project participants, project managers, team members, team leaders, stakeholders, and the entire organizations, for which this solution is intended, have access to the daily status of projects they are involved in.
Export from ConceptDraw MINDMAP to MS Project® XML
ConceptDraw MINDMAP can export to MS Project file from a mind map; it can also import a project file from MS Project giving team members who use Macintosh or Windows, a working visual map of a planned project. The ability to import/export MS Project files is made possible because of the Project Exchange solution.How to Create Presentation of Your Project Gantt Chart
During the planning, discussing and execution of a project you may need to prepare a presentation using project views such as the Gantt Chart, Multiproject Dashboard or Resource Usage View. It’s easy do with ConceptDraw PROJECT!Advanced printing in ConceptDraw Project
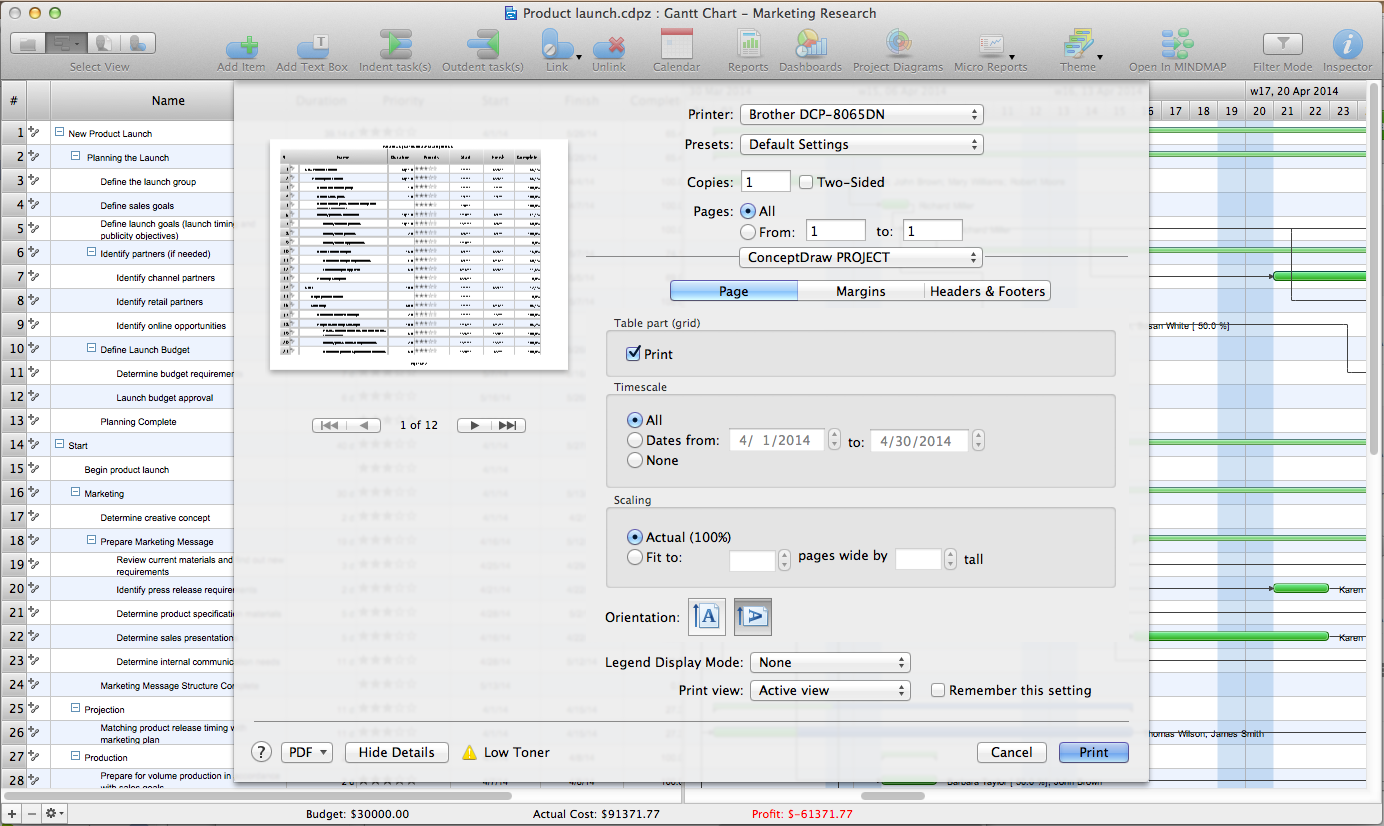
ConceptDraw PROJECT has flexible print settings that allowing you to easily print your project data to suite any need.Successful Strategic Plan
This sample shows the Strategic Plan of the Broadband Lifecycle that was developed by Strategic Networks Group. The Broadband Lifecycle represents the advance of the broadband investments.Gantt Chart Software
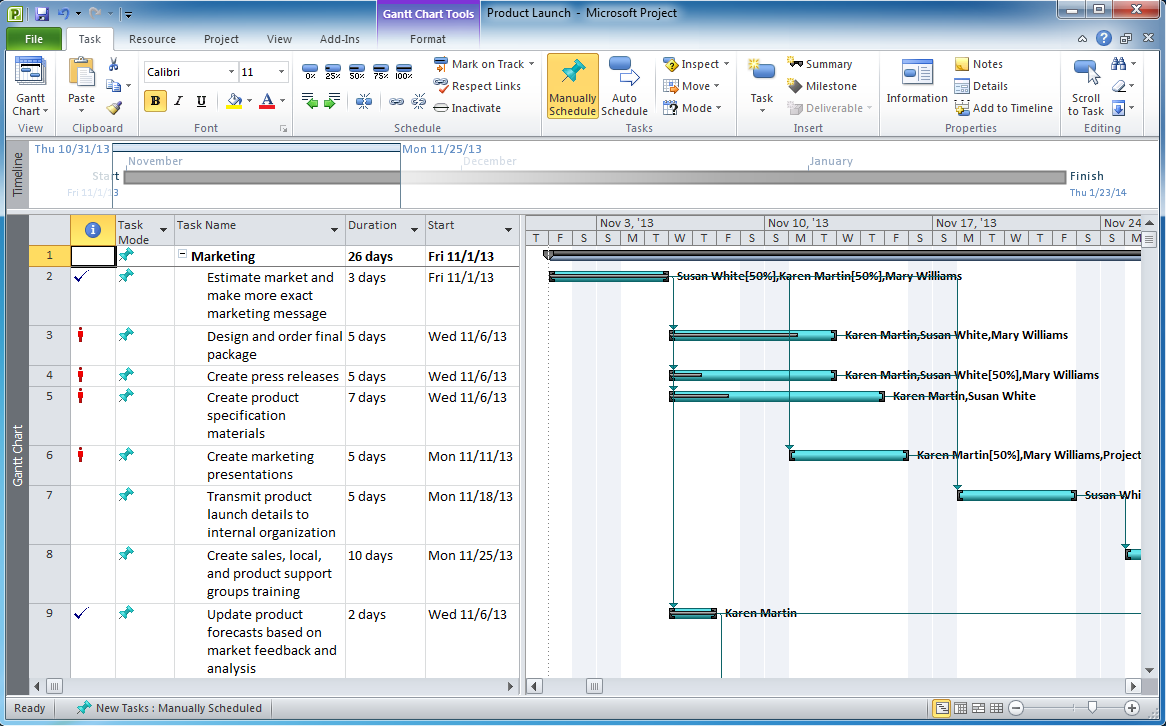
ConceptDraw PROJECT is a powerful Gantt Chart Software. The Gantt Charts are useful for displaying a large amount of detailed information, project tasks and timelines in a visually pleasing, easy-to-understand format. ConceptDraw PROJECT provides wide capabilities of importing and exporting in various formats: Microsoft Project, ConceptDraw MINDMAP, Mindjet MindManager, PDF file.HelpDesk
How to Create a Mind Map from Selected Tasks in Project
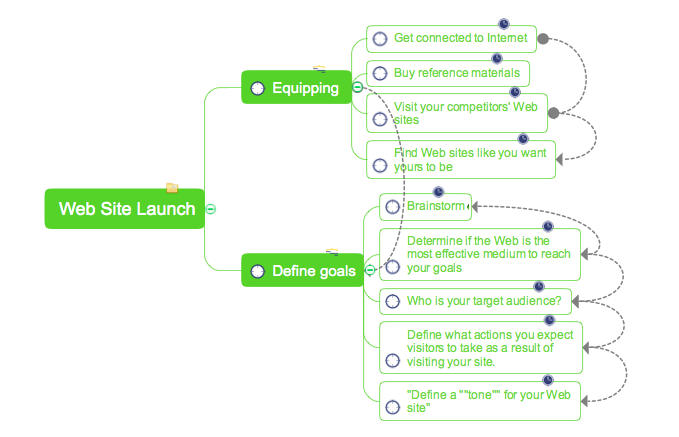
You can see the project data in a mind map structure by create a mind map from the selected project tasks.
- How to Track Your Project Plan vs . the Actual Project Condition ...
- Report Plan Vs Actual In Microsoft Project Planner
- How to Track Your Project Plan vs . the Actual Project Condition ...
- How to Track Your Project Plan vs . the Actual Project Condition ...
- How to Track Your Project Plan vs . the Actual Project Condition ...
- How to Track Your Project Plan vs . the Actual Project Condition ...
- How to Track Your Project Plan vs . the Actual Project Condition ...
- How to Track Your Project Plan vs . the Actual Project Condition ...
- How to Track Your Project Plan vs . the Actual Project Condition ...
- Baseline Ms Project
- How to Track Your Project Plan vs . the Actual Project Condition ...
- How to Track Your Project Plan vs . the Actual Project Condition ...
- Ms Project Sample Project Plan Construction
- Types Of Ms Project Dashboard Report
- How to Track Your Project Plan vs . the Actual Project Condition | PM ...
- Microsoft Project Charts
- How to Track Your Project Plan vs . the Actual Project Condition ...
- How to Track Your Project Plan vs . the Actual Project Condition ...
- How to Export Project Data to MS Excel Worksheet | How to Track ...

