This site uses cookies. By continuing to browse the ConceptDraw site you are agreeing to our Use of Site Cookies.
HelpDesk

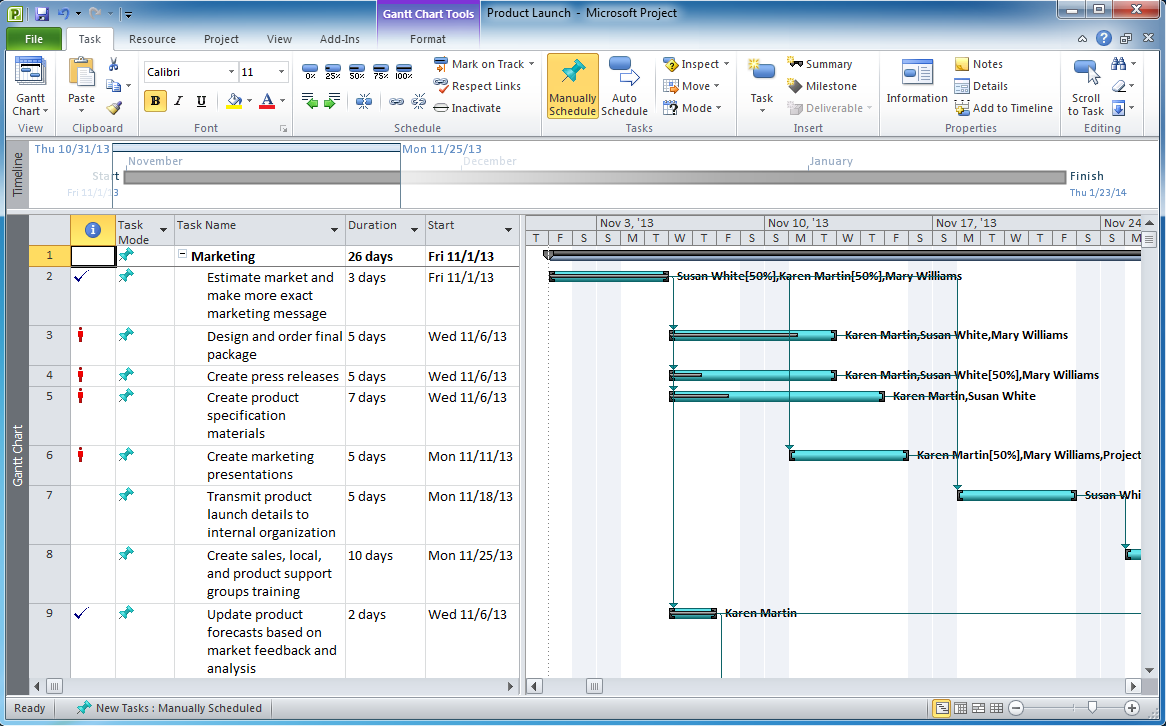
How to Track Your Project Plan vs. the Actual Project Condition

ConceptDraw PROJECT allows following how the project is going. You can easily compare the actual project data with the planned ones. The best tool for effective tracking of the project execution is to compare real data with the project baseline. It consists of the baseline start, baseline finish and baseline cost. Along with Baseline tracking ConceptDraw PROJECT offers several types of visual reports that can help to assess visually the difference between planned and actual project data.

Process Flowchart

ConceptDraw is Professional business process mapping software for making process flow diagram, workflow diagram, general flowcharts and technical illustrations for business documents. It is includes rich examples, templates, process flowchart symbols. ConceptDraw flowchart maker allows you to easier create a process flowchart. Use a variety of drawing tools, smart connectors, flowchart symbols and shape libraries to create flowcharts of complex processes, process flow diagrams, procedures and information exchange.
How To Create a Process Flow Chart (business process modelling techniques)

Export from ConceptDraw MINDMAP to MS Project® XML

ConceptDraw MINDMAP can export to MS Project file from a mind map; it can also import a project file from MS Project giving team members who use Macintosh or Windows, a working visual map of a planned project. The ability to import/export MS Project files is made possible because of the Project Exchange solution.

Landscape Plan

A landscape plan depicts all the features of a future garden including buildings, plants, lawns or a patio. Such plan is a very important part of site adjustment because it gives a complete picture of future project.

Hotel Network Topology Diagram

Hotel Network Topology Diagram - The Computer and Networks solution from Computer and Networks area of ConceptDraw Solution Park provides examples, templates and vector stencils library with symbols of local area network (LAN) and wireless LAN (WLAN) equipment.
Use it to draw the physical and logical network topology diagrams for wired and wireless computer communication networks.
Create Network Topology Diagram

Network Diagram Software Logical Network Diagram

Perfect Network Diagramming Software with examples of LAN Diagrams. ConceptDraw Network Diagram is ideal for network engineers and network designers who need to draw Logical Network diagrams.

How to Present a Social Media Response Plan DFD to Your Team

Interactive tool helps you find the appropriate response to social media mentions quickly. There are materials to help trainers and consultants develop a social media strategy and provide training for social media groups on how to effectively accomplish their daily work.

Landscape Plan

A landscape plan depicts all the features of a future garden including buildings, plants, lawns or a patio. Such plan is a very important part of site adjustment because it gives a complete picture of future project.

SWOT Template

The "SWOT Analysis" solution gives simple visual support for all the steps of a SWOT Analysis process. SWOT analysis is a strategic planning method used to evaluate the Strengths, Weaknesses, Opportunities, and Threats facing a project. The new template for ConceptDraw MINDMAP isually supports identifying internal and external factors that are favorable and unfavorable. When the analysis is complete, output your data to a SWOT Matrix in ConceptDraw DIAGRAM for exporting to a variety of other formats: MS Visio, PowerPoint presentation, PDF, image files, etc.

PDPC

ConceptDraw DIAGRAM extended with Seven Management and Planning Tools Solution from the Management Area of ConceptDraw Solution Park is the best software for drawing all types of diagrams from the Seven Management and Planning Tools: Affinity Diagram, Relations Diagram, Prioritization Matrix, Root Cause Analysis Tree Diagram, Involvement Matrix, PERT Chart, and Risk Diagram (PDPC).