Visual Presentations Made Easy with Diagramming Software


 Accounting Flowcharts
Accounting Flowcharts solution extends ConceptDraw DIAGRAM software with templates, samples and library of vector stencils for drawing the accounting flow charts.
Software Diagrams

Pyramid Chart Examples

Business process Flow Chart — Event-Driven Process chain (EPC) diagrams

 Event-driven Process Chain Diagrams
Event-Driven Process Chain Diagrams solution extends ConceptDraw DIAGRAM functionality with event driven process chain templates, samples of EPC engineering and modeling the business processes, and a vector shape library for drawing the EPC diagrams and EPC flowcharts of any complexity. It is one of EPC IT solutions that assist the marketing experts, business specialists, engineers, educators and researchers in resources planning and improving the business processes using the EPC flowchart or EPC diagram. Use the EPC solutions tools to construct the chain of events and functions, to illustrate the structure of a business process control flow, to describe people and tasks for execution the business processes, to identify the inefficient businesses processes and measures required to make them efficient.
Venn Diagram Examples for Problem Solving. Environmental Social Science. Human Sustainability Confluence

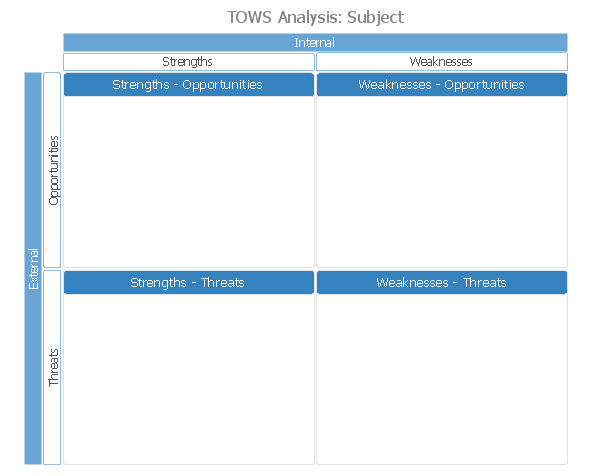
TOWS Analysis Software
Bar Chart Software

 Social Media Response
This solution extends ConceptDraw DIAGRAM and ConceptDraw MINDMAP with the ability to draw interactive flow charts with action mind map templates, to help create an effective response to applicable social media mentions.
Onion Diagram Maker

Column Chart Template

Flow Chart Symbols

 Value Stream Mapping
Value stream mapping solution extends ConceptDraw DIAGRAM software with templates, samples and vector stencils for drawing the Value Stream Maps (VSM) in lean manufacturing practice.
 HR Flowcharts
Human resource management diagrams show recruitment models, the hiring process and human resource development of human resources.
- Pie Chart Examples and Templates | Process Flowchart | Lean Six ...
- Bar Diagram Math | Process Diagrams | Percentage Pie Chart . Pie ...
- Bar Diagram Math | Management Consultant | Influence Diagram ...
- Business Report Pie. Pie Chart Examples | Bar Chart Examples ...
- Bar Diagram Math | Management Consultant | Landscape ...
- Schedule pie chart - Daily action plan | Think. Act. Accomplish ...
- How to Create Management Infographics Using ConceptDraw PRO ...
- Management Consultant | Directions Maps | Maps Driving Directions ...
- Org Chart Category Management
- Basic Flowchart Symbols and Meaning | Organizational Chart ...
- Process Diagrams | Management Consultant | Bar Diagram Math ...
- Infographic Generator | How to Create a Typography Infographic ...
- Process Flowchart | Prioritization Matrix | Management Consultant ...
- Infographic Generator | Management Tools | Infographic Examples ...
- Pie charts - Vector stencils library | Data-driven charts - Vector ...
- Relative Value Chart Software | Pyramid Chart Examples | Pie Chart ...
- Bar Graphs | Sales Growth. Bar Graphs Example | Line Graphs ...
- Financial Comparison Chart | Bar Diagrams for Problem Solving ...
- PROBLEM ANALYSIS. Root Cause Analysis Tree Diagram ...
- How to Draw the Different Types of Pie Charts | Ring chart ...