PROBLEM ANALYSIS. Root Cause Analysis Tree Diagram


Process Flowchart


Visual Diagramming

Bar Diagrams for Problem Solving. Create event management bar charts with Bar Graphs Solution

Use it to design your audio, video and multimedia illustrations, presentations, web pages and infographics with ConceptDraw PRO diagramming and vector drawing software.
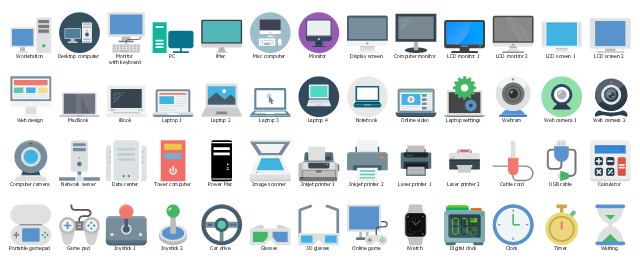
"Computer hardware (or simply hardware in computing contexts) is the collection of physical elements that constitutes a computer system. Computer hardware is the physical parts or components of a computer, such as the monitor, keyboard, computer data storage, hard disk drive (HDD), graphic cards, sound cards, memory (RAM), motherboard, and so on, all of which are tangible physical objects." [Computer hardware. Wikipedia]
The clipart example "Computers" is included in the Audio, Video, Media solution from the Illustrations area of ConceptDraw Solution Park.
Basic Flowchart Symbols and Meaning


Management Consultant

A management consultant is an important person for the company, he helps in the questions of improving business performance and increasing profits, he consults for the questions of business strategy, management and financial controls, resources, and also suggests recommendations for changing the structure of the company if needed.
So, every day management consultant conduct the complex work and often use the helpful management infographics for explain his thoughts and arguments to the company direction. Thanks to the development of computer technologies, drawing of management infographics is so easy today. ConceptDraw PRO diagramming and vector drawing software offers you the Management Infographics Solution from the Business Infographics Area.
Use Case Diagrams technology with ConceptDraw PRO

Communication Tool for Remote Project Management

Social Media Response Management DFD Charts - software tools


ConceptDraw Arrows10 Technology

Audio Visual Cables and Connectors

 ConceptDraw Solution Park
The Live Objects designed to display actual measures of performance metrics and KPIs from external data source files.
Some of them also display comparative measures, and colored zones of qualitative ranges with legend.
Use it to draw business performance dashboards using the ConceptDraw PRO diagramming and vector drawing software .
"Digital dashboards may be laid out to track the flows inherent in the business processes that they monitor. Graphically, users may see the high-level processes and then drill down into low level data. This level of detail is often buried deep within the corporate enterprise and otherwise unavailable to the senior executives. ...
Specialized dashboards may track all corporate functions. Examples include human resources, recruiting, sales, operations, security, information technology, project management, customer relationship management and many more departmental dashboards. ...
Like a car's dashboard (or control panel), a software dashboard provides decision makers with the input necessary to "drive" the business. Thus, a graphical user interface may be designed to display summaries, graphics (e.g., bar charts, pie charts, bullet graphs, "sparklines," etc.), and gauges (with colors similar to traffic lights) in a portal-like framework to highlight important information. ...
Digital dashboards allow managers to monitor the contribution of the various departments in their organization. To gauge exactly how well an organization is performing overall, digital dashboards allow you to capture and report specific data points from each department within the organization, thus providing a "snapshot" of performance." [Dashboard (management information systems). Wikipedia]
The example "Design elements - Meter indicators" is included in the Meter Dashboard solution from the area "What is a Dashboard" of ConceptDraw Solution Park.

- Design And Technology
- Design elements - Technology | Draw Ict Gadget
- Conceptdraw.com: Mind Map Software, Drawing Tools | Project ...
- Performance Indicators | PM Dashboards | Design elements - Sales ...
- Design elements - Technology | Technology - Vector stencils library ...
- Seven Management and Planning Tools
- PM Dashboards | Performance Indicators | Enterprise dashboard ...
- PM Personal Time Management | Schedule pie chart - Daily action ...
- Process Flowchart | ConceptDraw Arrows10 Technology | The Best ...
- Drawing On Computer In Communication Technology
- Seven Management and Planning Tools | PROBLEM ANALYSIS ...
- Project Management Software
- Chart Of Management Information System With Diagram
- Management Information System
- Enterprise dashboard | HR Flowcharts | KPI Dashboard | Human ...
- ConceptDraw Solution Park | Education Infographics | Design ...
- Quality Project Management with Mind Maps | Total Quality ...
- Network Diagramming Software for Design Computer and Network ...
- Audio Connectors | ConceptDraw Arrows10 Technology | Audio ...
- PM Dashboards | How to Use ConceptDraw Sales Dashboard ...