Organizational Structure Total Quality Management

Total Quality Management Value

Total Quality Management Definition

Total Quality Management with ConceptDraw
 method - Fishbone diagram template")
Quality Management System

Process Flowchart


TQM Tools

Total Quality Management

TQM Software

"Flow Charts ...
Pictures, symbols or text coupled with lines, arrows on lines show direction of flow. Enables modelling of processes; problems/ opportunities and decision points etc. Develops a common understanding of a process by those involved. No particular standardisation of symbology, so communication to a different audience may require considerable time and explanation." [ifm.eng.cam.ac.uk/ research/ dstools/ tqm-tools/ ]
The TQM diagram template for the ConceptDraw PRO diagramming and vector drawing software is included in the Total Quality Management (TQM) Diagrams solution from the Quality area of ConceptDraw Solution Park.
TQM flowchart template
Quality Management Tools
-Diagram-in-SolutionBrowser.png "Quality Management Tools")
Quality Control Chart Software — ISO Flowcharting

This TQM diagram sample was redesigned from the illustration of "Inland acid sulfate soil and water quality fact sheet" from website of the Department of the Environment of the Australian Government.
[environment.gov.au/ resource/ inland-acid-sulfate-soil-and-water-quality-fact-sheet]
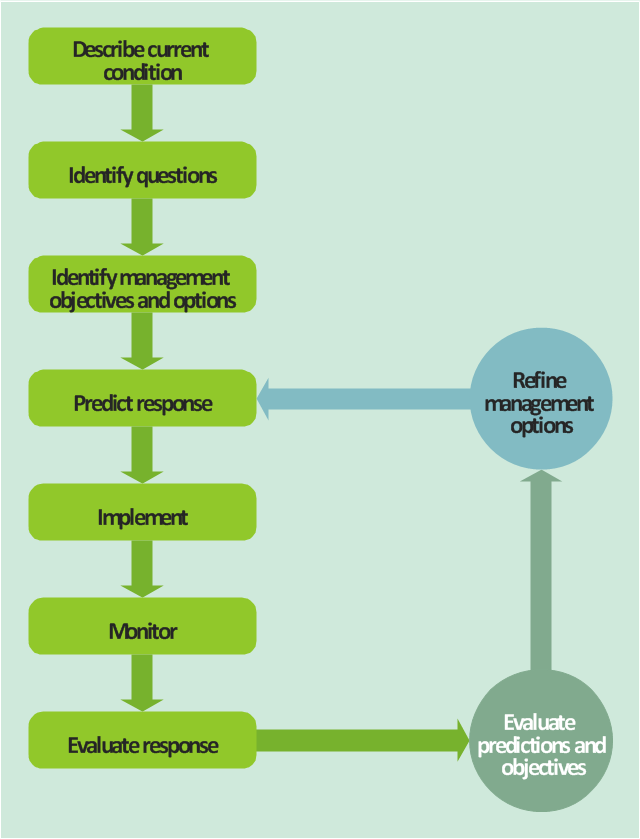
"Adaptive management (AM), also known as adaptive resource management (ARM), is a structured, iterative process of robust decision making in the face of uncertainty, with an aim to reducing uncertainty over time via system monitoring. In this way, decision making simultaneously meets one or more resource management objectives and, either passively or actively, accrues information needed to improve future management. Adaptive management is a tool which should be used not only to change a system, but also to learn about the system (Holling 1978). Because adaptive management is based on a learning process, it improves long-run management outcomes. The challenge in using the adaptive management approach lies in finding the correct balance between gaining knowledge to improve management in the future and achieving the best short-term outcome based on current knowledge (Allan & Stankey 2009)." [Adaptive management. Wikipedia]
The TQM flowchart example "Acid sulfate soil adaptive management framework" was created using the ConceptDraw PRO diagramming and vector drawing software extended with the Total Quality Management (TQM) Diagrams solution from the Quality area of ConceptDraw Solution Park.
[environment.gov.au/ resource/ inland-acid-sulfate-soil-and-water-quality-fact-sheet]
"Adaptive management (AM), also known as adaptive resource management (ARM), is a structured, iterative process of robust decision making in the face of uncertainty, with an aim to reducing uncertainty over time via system monitoring. In this way, decision making simultaneously meets one or more resource management objectives and, either passively or actively, accrues information needed to improve future management. Adaptive management is a tool which should be used not only to change a system, but also to learn about the system (Holling 1978). Because adaptive management is based on a learning process, it improves long-run management outcomes. The challenge in using the adaptive management approach lies in finding the correct balance between gaining knowledge to improve management in the future and achieving the best short-term outcome based on current knowledge (Allan & Stankey 2009)." [Adaptive management. Wikipedia]
The TQM flowchart example "Acid sulfate soil adaptive management framework" was created using the ConceptDraw PRO diagramming and vector drawing software extended with the Total Quality Management (TQM) Diagrams solution from the Quality area of ConceptDraw Solution Park.
TQM diagram
In searching of alternative to MS Visio for MAC and PC with ConceptDraw PRO

This TQM diagram example was redesigned from the illustration of the Highway Performance Monitoring System (HPMS) Field Manual from the website of the Federal Highway Administration (FHWA).
[fhwa.dot.gov/ policyinformation/ hpms/ fieldmanual/ chapter7.cfm]
"Highway Performance Monitoring System (HPMS).
The HPMS is a national level highway information system that includes data on the extent, condition, performance, use and operating characteristics of the nation's highways. The HPMS contains administrative and extent of system information on all public roads, while information on other characteristics is represented in HPMS as a mix of universe and sample data for arterial and collector functional systems. Limited information on travel and paved miles is included in summary form for the lowest functional systems.
HPMS was developed in 1978 as a continuing database, replacing the special biennial condition studies that had been conducted since 1965. The HPMS has been modified several times since its inception. Changes have been made to reflect changes in the highway systems, legislation, and national priorities, to reflect new technology, and to consolidate or streamline reporting requirements." [fhwa.dot.gov/ policyinformation/ hpms.cfm]
The TQM flowchart example "Software workflow diagram" was created using the ConceptDraw PRO diagramming and vector drawing software extended with the Total Quality Management (TQM) Diagrams solution from the Quality area of ConceptDraw Solution Park.
TQM diagram

Value Stream Mapping

ConceptDraw PRO Compatibility with MS Visio

Value Stream Mapping Template

MS Visio Look a Like Diagrams

"Classic TQM Tools ...
Flow Charts Pictures, symbols or text coupled with lines, arrows on lines show direction of flow. Flowcharting enables
modeling of processes; problems/ opportunities and decision points etc. It develops a common understanding of a process by those in
volved." [whaqualitycenter.org/ Portals/ 0/ Tools%20 to%20 Use/ Classic%20 Quality%20 Tools/ Classic%20 TQM%20 Tools%20 R%20 2-12.pdf]
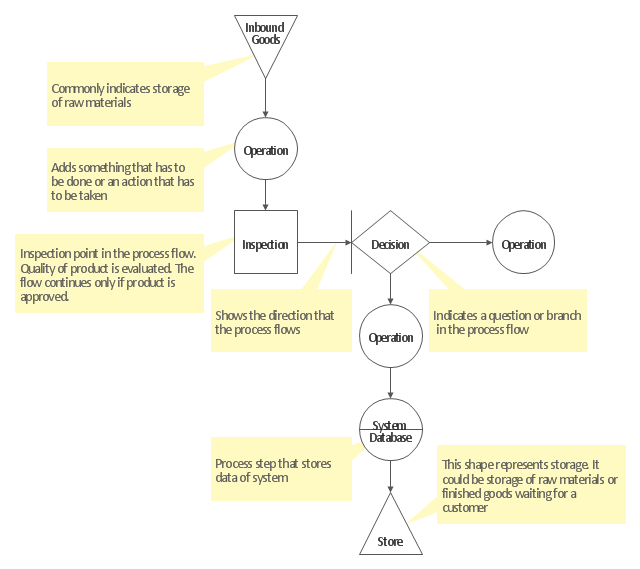
The vector stencils library TQM diagrams contains 58 symbols for drawing total quality management (TQM) flow charts using the ConceptDraw PRO diagramming and vector drawing software.
The example "Design elements - TQM diagram" is included in the Total Quality Management (TQM) Diagrams solution from the Quality area of ConceptDraw Solution Park.
Flow Charts Pictures, symbols or text coupled with lines, arrows on lines show direction of flow. Flowcharting enables
modeling of processes; problems/ opportunities and decision points etc. It develops a common understanding of a process by those in
volved." [whaqualitycenter.org/ Portals/ 0/ Tools%20 to%20 Use/ Classic%20 Quality%20 Tools/ Classic%20 TQM%20 Tools%20 R%20 2-12.pdf]
The vector stencils library TQM diagrams contains 58 symbols for drawing total quality management (TQM) flow charts using the ConceptDraw PRO diagramming and vector drawing software.
The example "Design elements - TQM diagram" is included in the Total Quality Management (TQM) Diagrams solution from the Quality area of ConceptDraw Solution Park.
TQM flow chart symbols

- TQM Diagram Example
- TQM Diagram Example | How To Convert a Business Process ...
- Design elements - TQM diagram | Total Quality Management TQM ...
- Design elements - TQM diagram | Management Tools — Total ...
- Design elements - TQM diagram | Process Flowchart | Business ...
- Total Quality Management TQM Diagrams | TQM diagram template ...
- Total Quality Management Definition | Design elements - TQM ...
- Tqm Chart
- Basic Flowchart Symbols | Collaboration in a Project Team | TQM ...
- TQM diagram template | ConceptDraw Solution Park | Entity ...
- TQM diagram template | TQM diagram example | Rapid UML ...
- Create TQM Flowcharts for Mac | Total Quality Management TQM ...
- Process Flowchart | Design elements - TQM diagram | How to ...
- Total Quality Management TQM Diagrams | TQM Diagram ...
- Total Quality Management TQM Diagrams | TQM Diagram Example ...
- Flowchart Software | Create TQM Flowcharts for Mac | Cross ...
- Entity-Relationship Diagram (ERD) | Process Flowchart | How to ...
- Process Flowchart | How to Draw a Process Flow Diagram in ...
- System Flowchart Symbols And Functions Pdf
- Professional Diagram and Flowchart Software | TQM Diagram ...