Stakeholder Onion Diagram Template

How To Create Onion Diagram

Onion Diagram Templates

Onion Diagram Process Design

Stakeholder Onion Diagrams

Onion Diagram Maker

 Stakeholder Onion Diagrams
The Stakeholder Onion Diagram is often used as a way to view the relationships of stakeholders to a project goal. A basic Onion Diagram contains a rich information. It shows significance of stakeholders that will have has influence to the success achieve
Stakeholder Management System

HelpDesk
How to Create a Stakeholder Onion Diagram Using ConceptDraw PRO

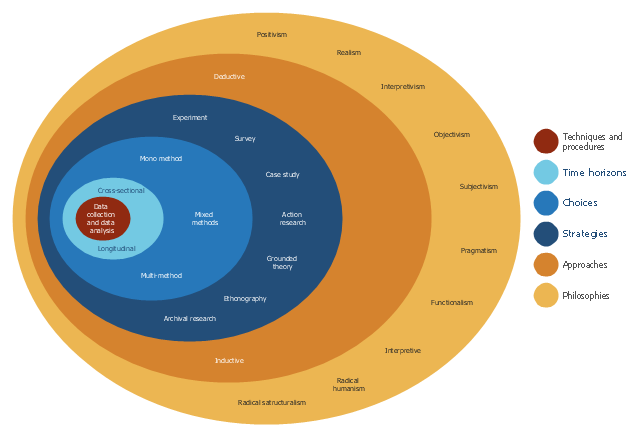
This onion diagram example was designed on the base of figure "Research onion" in the article "The research methodology for the development of a kaizen costing framework suitable for indigenous construction firms in Lagos, Nigeria." by T. Omotayo and U. Kulatunga from the Association of Researchers in Construction Management (ARCOM) website.
"The need for a cost management paradigm shift in the construction industry is imperative because of the prevailing challenges of managing construction cost during construction. Small and medium scale construction firms in Nigeria are faced with the challenges of competition from foreign firm, cost overrun, project delays and unsatisfied clients. This challenge may be handled with kaizen principles and kaizen costing. This paper utilized literatures related to research methodology in the built environment to create a research framework for the study. This focused on the research philosophical stands, approaches and strategy related to the built environment. The research onion model was adopted for the framework development and the sample size of two hundred and fifty (250) respondents was selected based on theoretical sampling for quantitative data collection using questionnaires." [arcom.ac.uk/ -docs/ workshops/ 2015-04_ Dublin-Proceedings.pdf]
The onion diagram example "Research onion diagram" was drawn using the ConceptDraw PRO software extended with the Stakeholder Onion Diagrams solution from the Management area of ConceptDraw Solution Park.
Onion diagram example
This onion diagram sample was created on the base of the figure "Social Ecological Model (SEM)" illustrating the webpage "Cultural Competence" from the US Centers for Disease Control and Prevention (CDC) website.
"Why consider cultural competence?
It is important to communicate effectively to both the disparately affected population(s) of interest as well as other key stakeholders at the community, state, and national levels.
The diagram of the Social Ecological Model (SEM) ... depicts how health behaviors of an individual (inner oval) are influenced by the interpersonal, organizational, community, and public policy contexts and environment in which that person exists. Cultural context resides in the interpersonal band, making it a critical consideration when designing any communication plan. All obesity prevention communications should take the culture (e.g., language, thoughts, communications, actions, customs, beliefs, values, and institutions of racial, ethnic, religious, or social groups) of the target population into consideration to be effective. Interventions that successfully achieve this goal demonstrate cultural competence - behaviors, attitudes, and policies that come together in a system, agency, or among professionals to enable people to work effectively in a cross-cultural situation."
[cdc.gov/ obesity/ health_ equity/ culturalRelevance.html]
The onion diagram example "Social Ecological Model (SEM)" was created using the ConceptDraw PRO diagramming and vector drawing software extended with the Target and Circular Diagrams solution from the Marketing area of ConceptDraw Solution Park.
www.conceptdraw.com/ solution-park/ marketing-target-and-circular-diagrams
Onion diagram
---onion-diagram.png--diagram-flowchart-example.png)
Visualize Stakeholder Analysis

Venn Diagram Template

Stakeholder Mapping Tool

- Onion Diagram Example
- New Stakeholder Onion Diagrams Solution for ConceptDraw PRO v10
- Sector diagram - Template | New Zealand Public Sector Agencies ...
- Process Flowchart | Pie Chart Examples and Templates | How To ...
- Stakeholder diagram | Stakeholder Onion Diagrams | How To ...
- Sector diagram - Template | How To Create Onion Diagram ...
- Onion Diagram Templates | How To Create Onion Diagram | Onion ...
- Target Diagram | Target market - Onion diagram | Target market ...
- Onion Diagram Examples
- Stakeholder Onion Diagram Template | Stakeholder Mapping Tool ...
- Onion Diagram Maker | How To Create Onion Diagram | Onion ...
- Target market | Target market - Onion diagram | Scatter Chart ...
- Stakeholder Mapping Tool | Stakeholder Onion Diagrams | Venn ...
- Design elements - Stakeholder icons | Stakeholder Onion Diagram ...
- Onion Diagram Templates | How To Create Onion Diagram ...
- Research onion diagram
- Stakeholder Onion Diagrams | Onion Diagram Process Design ...
- Onion Diagram Templates | Hotel Network Topology Diagram | Data ...
- Onion Diagram Templates