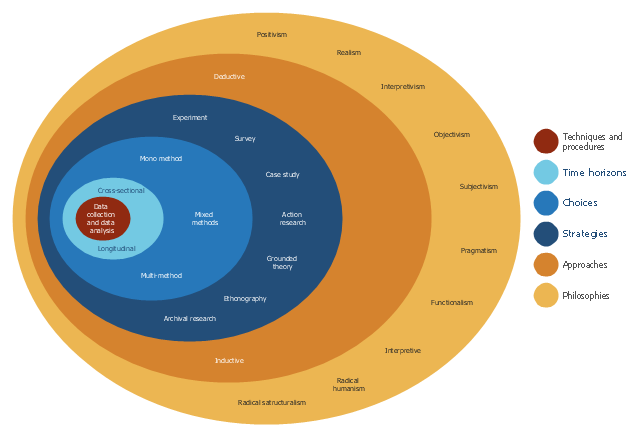
This onion diagram example was designed on the base of figure "Research onion" in the article "The research methodology for the development of a kaizen costing framework suitable for indigenous construction firms in Lagos, Nigeria." by T. Omotayo and U. Kulatunga from the Association of Researchers in Construction Management (ARCOM) website.
"The need for a cost management paradigm shift in the construction industry is imperative because of the prevailing challenges of managing construction cost during construction. Small and medium scale construction firms in Nigeria are faced with the challenges of competition from foreign firm, cost overrun, project delays and unsatisfied clients. This challenge may be handled with kaizen principles and kaizen costing. This paper utilized literatures related to research methodology in the built environment to create a research framework for the study. This focused on the research philosophical stands, approaches and strategy related to the built environment. The research onion model was adopted for the framework development and the sample size of two hundred and fifty (250) respondents was selected based on theoretical sampling for quantitative data collection using questionnaires." [arcom.ac.uk/ -docs/ workshops/ 2015-04_ Dublin-Proceedings.pdf]
The onion diagram example "Research onion diagram" was drawn using the ConceptDraw PRO software extended with the Stakeholder Onion Diagrams solution from the Management area of ConceptDraw Solution Park.
Onion diagram example
Basic Flowchart Symbols and Meaning


Electrical Symbols, Electrical Diagram Symbols

Pie Chart Examples and Templates

ERD Symbols and Meanings


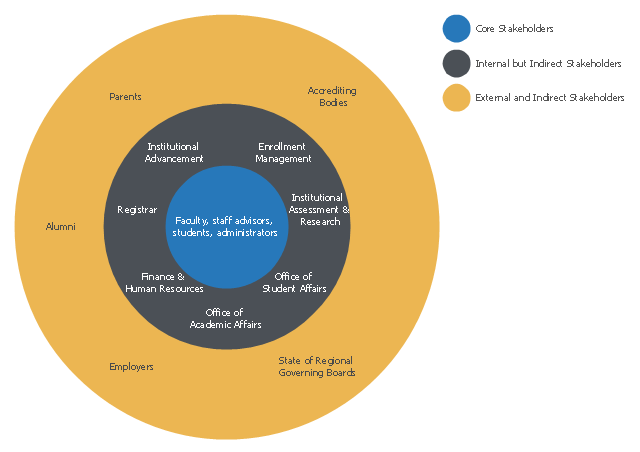
This onion diagram example was designed on the base of figure "Academic advising stakeholder framework" in the article "Defining Advising Stakeholder Groups" by Julianne Messia from the website of NACADA Executive Office,
Kansas State University.
"A complete stakeholder analysis, therefore, not only names the stakeholders but accurately characterizes each stakeholder’s power and influence.
Harney (2008) identified advising stakeholders as being either internal or external constituents. Stakeholders belong in one of three distinct classifications: (1) internal core stakeholders, (2) internal but indirect stakeholders, and (3) external and indirect stakeholders. The chart below (Figure 1) depicts these groups in a diagram representing their various levels of input, influence, and involvement; the closer a group is to the “core” the more investment and weight that group has in advising. The groups utilized in this specific example assume a shared model of advising (both faculty and advising professionals have advising responsibilities). As each institution has its own unique culture and advising model, the chart should be adapted for any program or institution. For instance, an institution with a centralized advising model may list faculty as Internal but Indirect Stakeholders as they do not provide or administer advising directly."
[nacada.ksu.edu/ Resources/ Clearinghouse/ View-Articles/ Defining-Advising-Stakeholder-Groups.aspx]
The onion diagram example "Stakeholder diagram" was drawn using the ConceptDraw PRO software extended with the Stakeholder Onion Diagrams solution from the Management area of ConceptDraw Solution Park.
Onion diagram example
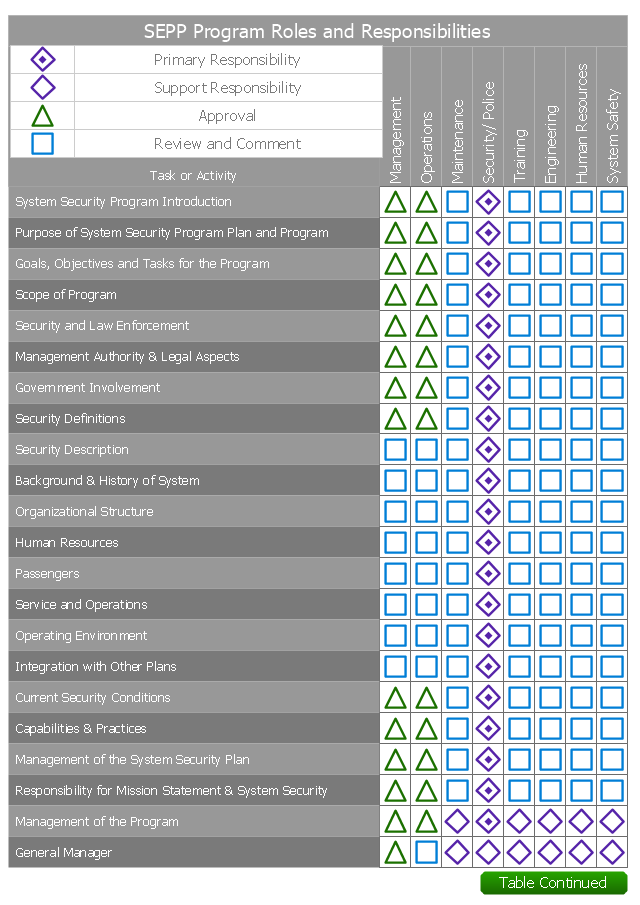
This involvement matrix example shows distribution of roles and responsibilities in the Standardised Emergency Preparedness Plan (SEPP) program.
"The Standardised Emergency Preparedness Plan (SEPP) is a concept of three part, seven stage emergency plans, originally conceived in 1998. The objective of the SEPP-concept is to be able to use a common structure for emergency plans for authorities and private organisations, disregarding the local or national or even international legislative or regulatory context and the type of emergency situation the plan is conceived for. Whilst the initial concept has been a personal research driven initiative, the SEPP-methodology is now used as the standard structure by CEMAC. SEPP-plans are in use in Belgium and in various other European countries." [Standardised Emergency Preparedness Plan. Wikipedia]
"CEMAC - acronym for Crisis & Emergency Management Centre - is a Belgian Centre of Expertise active nationally and internationally in the field of crisis management." [cemac.org]
The involvement matrix example "SEPP program roles and responsibilities" was created using the ConceptDraw PRO diagramming and vector drawing software extended with the solution "Seven Management and Planning Tools" from the Management area of ConceptDraw Solution Park.
Involvement matrix
Matrix (continued)
-involvement-matrix---sepp-program-roles-and-responsibilities.png--diagram-flowchart-example.png)
Matrix (continued)
-involvement-matrix---sepp-program-roles-and-responsibilities.png--diagram-flowchart-example.png)
 Stakeholder Onion Diagrams
The Stakeholder Onion Diagram is often used as a way to view the relationships of stakeholders to a project goal. A basic Onion Diagram contains a rich information. It shows significance of stakeholders that will have has influence to the success achieve
Emergency Action Plan Template

Flowchart design. Flowchart symbols, shapes, stencils and icons


- Example Of Research Diagram
- Fire and Emergency Plans | Fire Extinguisher Legend
- Research Methodology Flow Chart Sample
- Research Framework Arrow Meaning
- Website Flow Legend
- Research onion diagram | Network Diagram Examples | Workflow ...
- Stakeholder Onion Diagrams | Research onion diagram | ATM UML ...
- Research onion diagram | Stakeholder Onion Diagrams | How To ...
- Legend For Flowchart