Design Element: Rack Diagram for Network Diagrams
.png)

Basic Network Diagram

HelpDesk
How to Create a Floor Plan
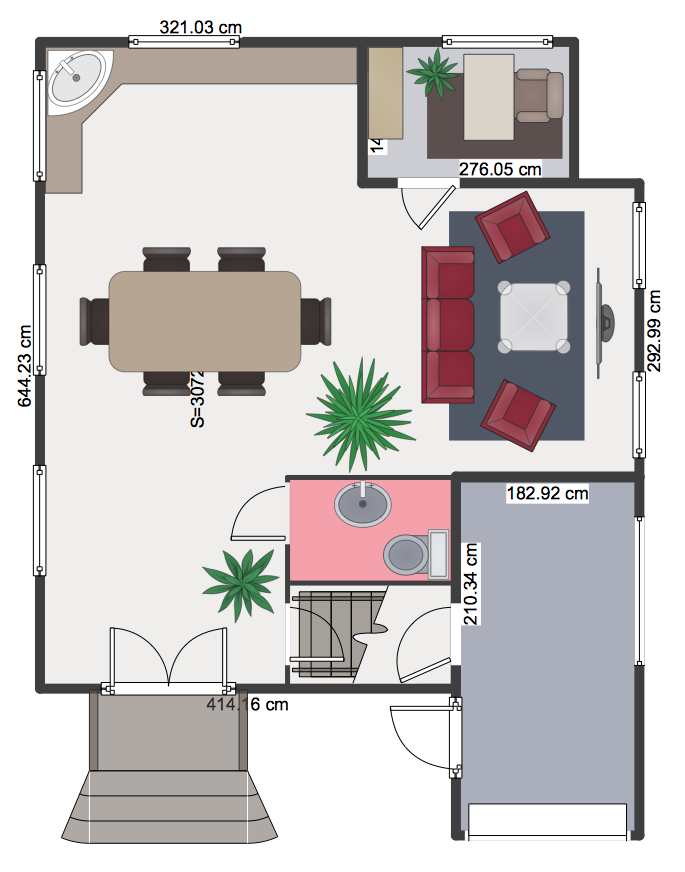
HelpDesk
How to Draw a Floor Plan for Your Office

HelpDesk
How to Create an IDEF0 Diagram for an Application Development

HelpDesk
How to Create an Electrical Diagram

 Interactive Voice Response Diagrams
Interactive Voice Response Diagrams solution extends ConceptDraw DIAGRAM software with samples, templates and libraries of ready-to-use vector stencils that help create Interactive Voice Response (IVR) diagrams illustrating in details a work of interactive voice response system, the IVR system’s logical and physical structure, Voice-over-Internet Protocol (VoIP) diagrams, and Action VoIP diagrams with representing voice actions on them, to visualize how the computers interact with callers through voice recognition and dual-tone multi-frequency signaling (DTMF) keypad inputs.
HelpDesk
How to Draw a Circular Arrows Diagram

 Event-driven Process Chain Diagrams
Event-Driven Process Chain Diagrams solution extends ConceptDraw DIAGRAM functionality with event driven process chain templates, samples of EPC engineering and modeling the business processes, and a vector shape library for drawing the EPC diagrams and EPC flowcharts of any complexity. It is one of EPC IT solutions that assist the marketing experts, business specialists, engineers, educators and researchers in resources planning and improving the business processes using the EPC flowchart or EPC diagram. Use the EPC solutions tools to construct the chain of events and functions, to illustrate the structure of a business process control flow, to describe people and tasks for execution the business processes, to identify the inefficient businesses processes and measures required to make them efficient.
HelpDesk
How to Create a Rack Diagram

 Enterprise Architecture Diagrams
Enterprise Architecture Diagrams solution extends ConceptDraw DIAGRAM software with templates, samples and library of vector stencils for drawing the diagrams of enterprise architecture models.
HelpDesk
How to Start Drawing a Diagram on Mac
 Cross-Functional Flowcharts
Cross-functional flowcharts are powerful and useful tool for visualizing and analyzing complex business processes which requires involvement of multiple people, teams or even departments. They let clearly represent a sequence of the process steps, the order of operations, relationships between processes and responsible functional units (such as departments or positions).
 Bar Graphs
The Bar Graphs solution enhances ConceptDraw DIAGRAM functionality with templates, numerous professional-looking samples, and a library of vector stencils for drawing different types of Bar Graphs, such as Simple Bar Graph, Double Bar Graph, Divided Bar Graph, Horizontal Bar Graph, Vertical Bar Graph, and Column Bar Chart.
 Chemical and Process Engineering
This chemical engineering solution extends ConceptDraw DIAGRAM.9.5 (or later) with process flow diagram symbols, samples, process diagrams templates and libraries of design elements for creating process and instrumentation diagrams, block flow diagrams (BFD
- Cisco Network Diagrams | 3D Network Diagram Software | How to ...
- Home area networks (HAN). Computer and Network Examples ...
- Network Diagram Examples | Physical LAN and WAN diagram ...
- Diagram Physical Topologies | Hotel Network Topology Diagram ...
- Wireless Network Topology | Hotel Network Topology Diagram ...
- Audio and Video Connectors | CCTV Network Diagram Software ...
- UML Class Diagram Tutorial | How to Create an IDEF0 Diagram for ...
- AWS Architecture Diagrams | Swim Lane Diagrams | Computer ...
- UML Diagrams with ConceptDraw PRO | UML Class Diagrams ...
- ConceptDraw PRO ER Diagram Tool | Network Diagramming ...
- Bubble diagrams in Landscape Design with ConceptDraw PRO ...
- Security and Access Plans | Databases Access Objects Model with ...
- UML Class Diagram Tutorial
- How To Create Restaurant Floor Plan in Minutes | Cafe and ...
- ConceptDraw PRO Network Diagram Tool | ConceptDraw PRO ER ...
- Plant Layout Plans | How To use House Electrical Plan Software ...
- Network Diagram Software (PRO) | How To Create Emergency ...
- ConceptDraw Solution Park | Software and Database Design with ...
- Diagramming Software for Design UML Interaction Overview Diagrams
- Flow Chart Design