Gant Chart in Project Management


Gantt Chart Software
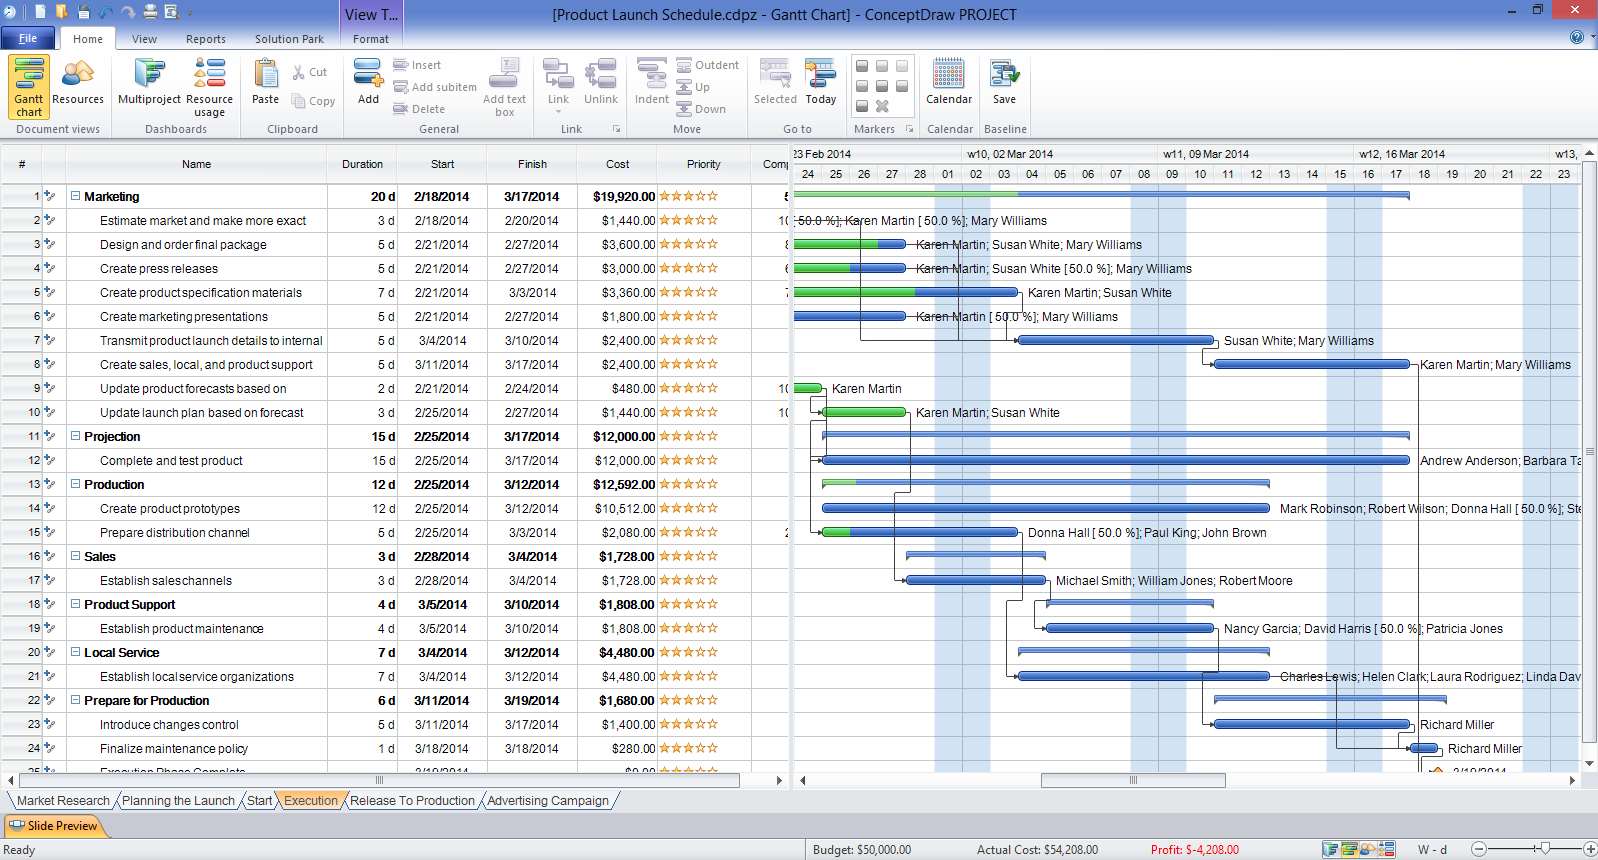
Gantt chart examples

Project — Working With Costs

HelpDesk
How to Shift Dates in ConceptDraw PROJECT

Donut Chart Templates

What Constitutes a Project?

ConceptDraw PROJECT Software Overview

A KPI Dashboard Provides the Answers Your Sales Team

Product Overview

How To Create Project Report

Critical Path Method in ConceptDraw PROJECT

Multi Layer Venn Diagram. Venn Diagram Example

PERT Chart Software

Business diagrams & Org Charts with ConceptDraw DIAGRAM


- Gantt Chart Multiple Projects
- Multiple Project Dashboard Template Excel
- Gant Chart in Project Management | Gantt charts for planning and ...
- PM Dashboards | How to Manage Multiple Projects on Windows ...
- Gantt Chart Templates | Gantt chart examples | How to Create ...
- How to Manage Multiple Projects on Windows | Process Flowchart ...
- Mind Map Gantt Chart For Multiple Projects
- How to Manage Multiple Projects on Windows | How to Create ...
- Status Dashboard | Construction Project Chart Examples | How to ...
- Pyramid Diagram | Gantt Chart Templates | Project Timeline | Project ...
- Gantt Chart Templates | How to Create Presentation of Your Project ...
- How to Report on Multiple Projects Status | PM Dashboards | Project ...
- How to Manage Multiple Projects on Windows | PM Dashboards ...
- Project Dashboard Examples Free
- Project Timeline | Gant Chart in Project Management | Timeline ...
- PM Dashboards | Construction Project Chart Examples ...
- How to Manage Multiple Projects on Windows | How to View Tasks ...
- Gantt chart examples | Online Marketing Objectives | Gant Chart in ...
- Mindmap Gantt Chart For Multiple Projects