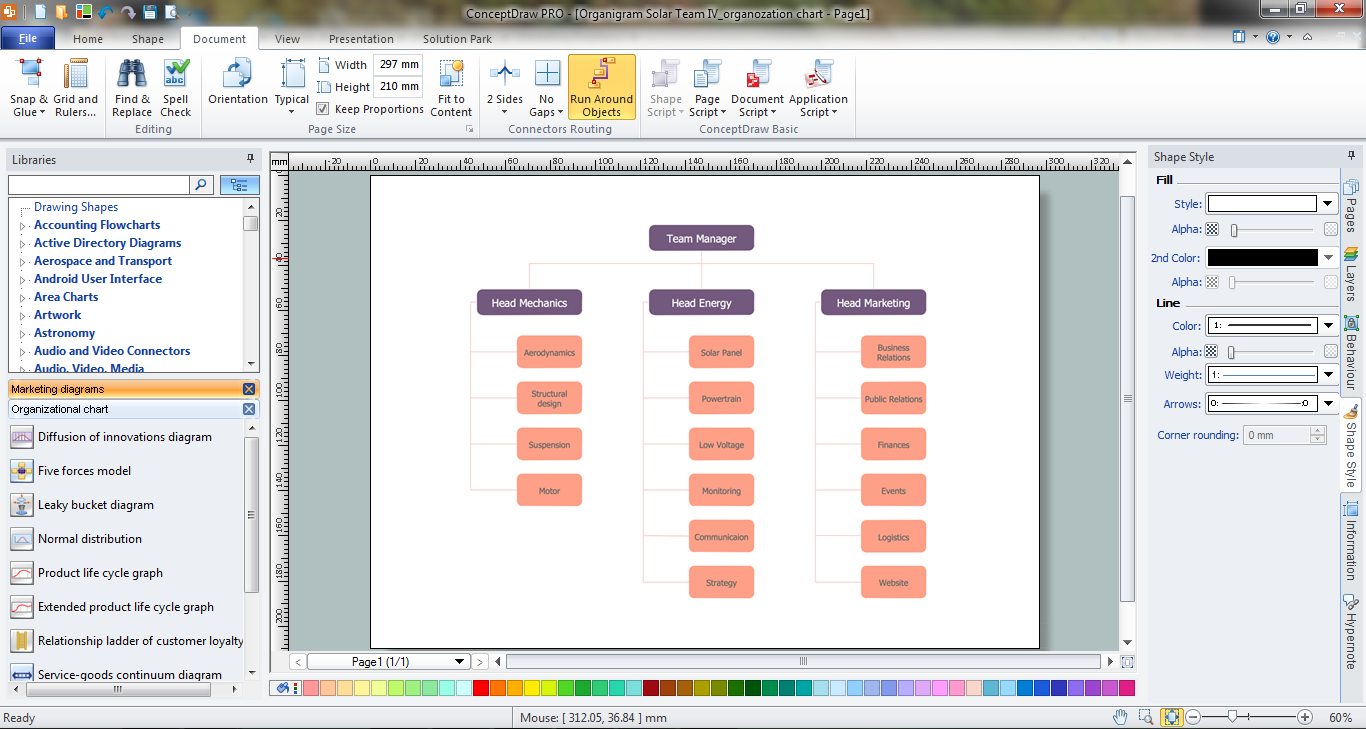
Marketing and Sales Organization chart. Organization chart Example

Marketing Organization Chart
 Organizational Charts
Organizational Charts solution extends ConceptDraw DIAGRAM software with samples, templates and library of vector stencils for drawing the org charts.
Business diagrams & Org Charts with ConceptDraw DIAGRAM


HelpDesk
How to Draw an Organizational Chart

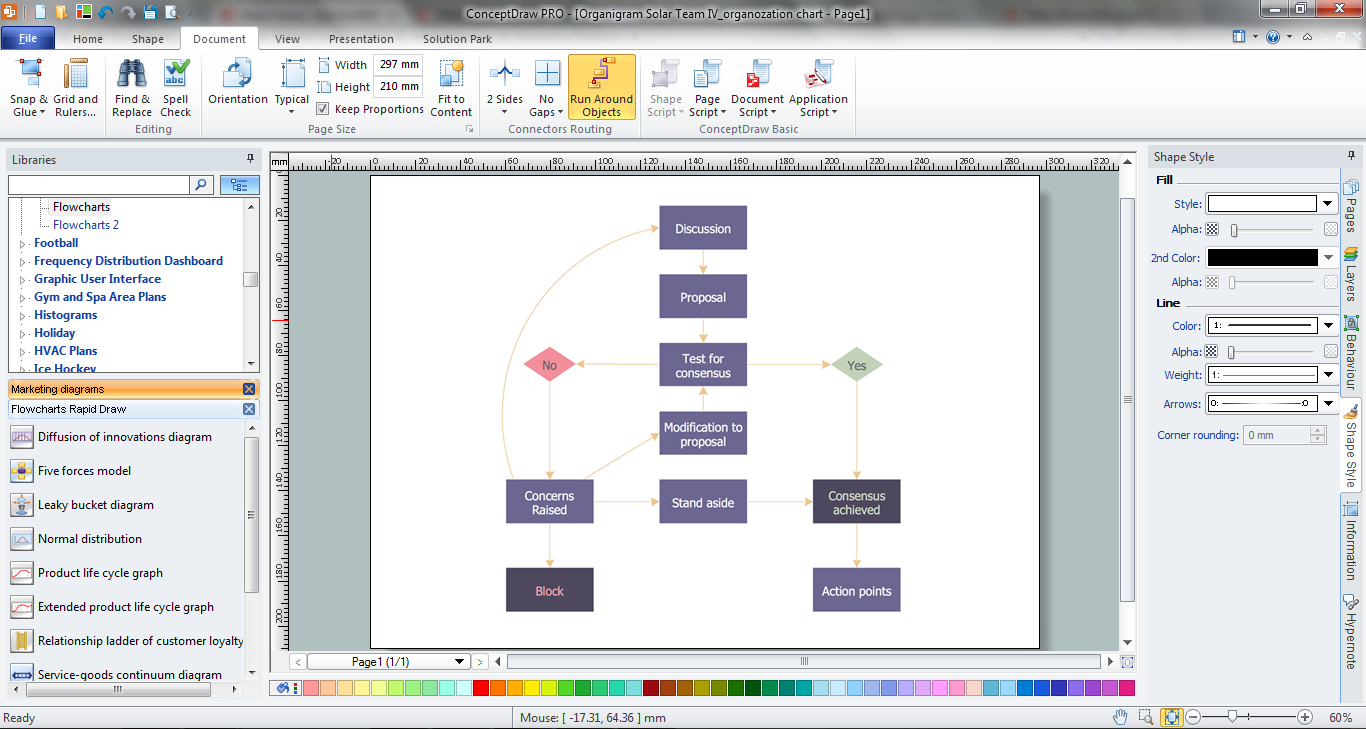
Marketing Flow Chart
 ConceptDraw Solution Park
ConceptDraw Solution Park collects graphic extensions, examples and learning materials
Market Chart
Marketing Charts

 25 Typical Orgcharts
The 25 Typical Orgcharts solution contains powerful organizational structure and organizational management drawing tools, a variety of professionally designed organization chart and matrix organization structure samples, 25 templates based on various orga
HelpDesk
How to Draw a Flat Organizational Chart

Pyramid Chart Examples

HelpDesk
How to Draw a Hierarchical Organizational Chart

Business Diagram Software


HelpDesk
How to Draw a Matrix Organizational Chart

HelpDesk
How to Create a Sales Flowchart

 Sales Dashboard
Sales Dashboard solution extends ConceptDraw DIAGRAM software with templates, samples and library of vector stencils for drawing the visual dashboards of sale metrics and key performance indicators (KPI).
HelpDesk
How to Create a Time Series Dashboard

HelpDesk
How to Use ConceptDraw Sales Dashboard Solution

- Marketing and Sales Organization chart . Organization chart Example
- Examples of Flowcharts, Org Charts and More | Marketing and Sales ...
- Marketing and Sales Organization chart . Organization chart ...
- Sales And Marketing Process Flow Chart
- Marketing and Sales Organization chart . Organization chart Example
- Marketing Sales Flow Chart
- Sales Process Flowchart. Flowchart Examples | Marketing and Sales ...
- Marketing and Sales Organization chart . Organization chart ...
- How to Draw an Organization Chart | Organizational Structure ...
- Marketing and Sales Organization chart . Organization chart Example
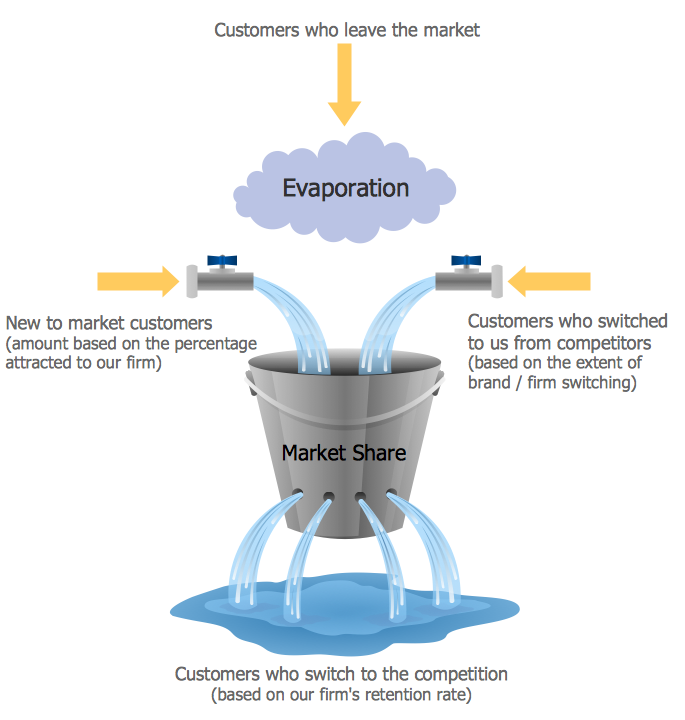
- Ladder of customer loyalty diagram | Marketing and Sales ...
- Business Process Marketing And Sales Flowchart
- Marketing Flow Chart
- Marketing Diagrams | Marketing | Marketing and Sales Organization ...
- Marketing Flow Chart Sample
- How to Draw an Organization Chart | Marketing and Sales ...
- Marketing Sales Flowcharts
- Orgchart | Marketing and Sales Organization chart . Organization ...
- Marketing Organization Chart | Marketing and Sales Organization ...
- Organizational Chart Templates | Marketing and Sales Organization ...