HelpDesk
How to Draw a Histogram in ConceptDraw PRO

How Do You Make a Histogram?

Make a Histogram

How To Make Histogram in ConceptDraw PRO?

How To Make a Histogram?

How To Draw a Histogram?

Histogram Chart

Histogram

Making a Histogram

Best Program to Make Diagrams


Basic Diagramming

Visual Presentations Made Easy with Diagramming Software

The Best Drawing Program for Mac


 Basic Diagramming
This solution extends ConceptDraw PRO software with the specific tools you need to easily draw flowcharts, block diagrams, histograms, pie charts, divided bar diagrams, line graphs, circular arrows diagrams, Venn diagrams, bubble diagrams and concept maps
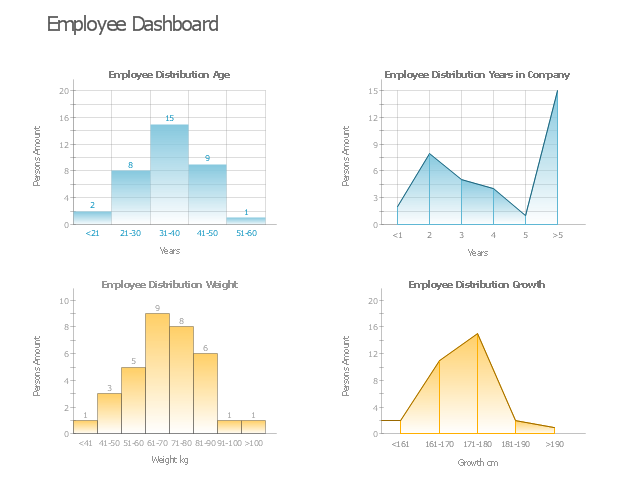
This HR dashboard example include histograms "Employee Distribution by Age" and "Employee Distribution by Weight", and area charts "Employee Distribution by Years in Company" and "Employee Distribution by Growth".
"Human resources is the set of individuals who make up the workforce of an organization, business sector, or economy. "Human capital" is sometimes used synonymously with human resources, although human capital typically refers to a more narrow view (i.e., the knowledge the individuals embody and can contribute to an organization). Likewise, other terms sometimes used include "manpower", "talent", "labour", or simply "people". The professional discipline and business function that oversees an organization's human resources is called human resource management (HRM, or simply HR)." [Human resources. Wikipedia]
The example "HR dashboard" was created using the ConceptDraw PRO diagramming and vector drawing software extended with the Frequency Distribution Dashboard solution from the area "What is a Dashboard" of ConceptDraw Solution Park.
Visual dashboard
Basic Diagramming

Basic Diagramming


Best Vector Drawing Application for Mac OS X

- How to Draw a Histogram in ConceptDraw PRO | Chart Examples ...
- Histograms | Visual Presentations Made Easy with Diagramming ...
- Chart Examples | Basic Diagramming | Best Software to Draw ...
- How to Draw a Histogram in ConceptDraw PRO | Chart Examples ...
- Histogram template | Frequency histogram - Page load time | Chart ...
- Histograms | Best Multi-Platform Diagram Software | Basic ...
- Histograms | Chart Examples | Frequency histogram - Beetles in the ...
- The Best Drawing Program for Mac | Best Software to Draw ...
- Histograms | Design elements - Histograms | Histogram template ...
- Histograms | Chart Examples | Black cherry tree histogram ...
- Best Multi-Platform Diagram Software | The Best Drawing Program ...
- Design elements - Histograms | Histogram template | Design ...
- Histogram template | Design elements - Histograms | Basic ...
- Simple Diagramming | Simple Drawing Applications for Mac | Visual ...
- The Best Drawing Program for Mac | Chart Examples | Best Multi ...
- Basic Diagramming | Basic Diagramming | The Best Drawing ...
- Frequency histogram - Page load time | Frequency histogram ...
- IDEF0 Diagrams | PM Easy | Histograms | Agile Approach Definition
- HR dashboard | Projects HR dashboard | Employee dashboard | Hr ...
- Basic Diagramming | Flowchart Example: Flow Chart of Marketing ...