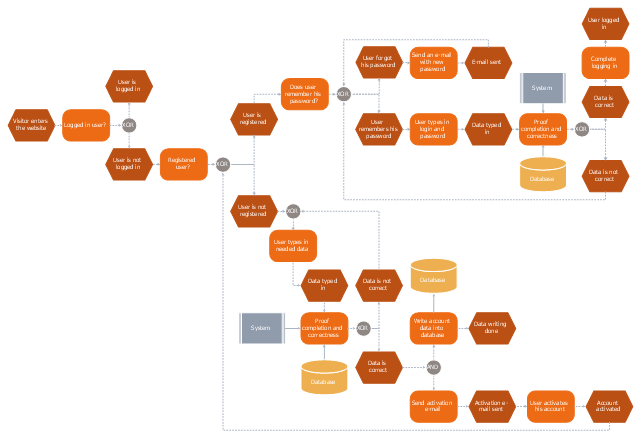
This event-driven process chain (EPC) flowchart sample depicts the login and registration processing.
"In computer security, a login or logon refers to the credentials required to obtain access to a computer system or other restricted area. Logging in or on and signing in or on is the process by which individual access to a computer system is controlled by identifying and authenticating the user through the credentials presented by the user.
Once a user has logged in, they can then log out or log off when access is no longer needed. To log out is to close off one's access to a computer system after having previously logged in." [Login. Wikipedia]
The event-driven process chain flowchart example "Login and registration processing" was created using the ConceptDraw PRO diagramming and vector drawing software extended with the Basic EPC solution from the Business Processes area of ConceptDraw Solution Park.
EPC flowchart

Account FlowchartFlowchart Examples

This computer security EPC diagram sample depicts the login and registration processing flow.
"In computer security, a login or logon refers to the credentials required to obtain access to a computer system or other restricted area. Logging in or on and signing in or on is the process by which individual access to a computer system is controlled by identifying and authenticating the user through the credentials presented by the user.
Once a user has logged in, they can then log out or log off when access is no longer needed. To log out is to close off one's access to a computer system after having previously logged in." [Login. Wikipedia]
The event-driven process chain (EPC) flowchart example "Login and registration processing" was created using the ConceptDraw PRO diagramming and vector drawing software extended with the Event-driven Process Chain Diagrams solution from the Business Processes area of ConceptDraw Solution Park.
EPC flowchart
EPC (Event-driven Process Chain) Flowcharts
 Flowcharts *")
Flowchart

Process Modelling using Event-driven Process chain

EPC

Flow Chart Online

Sales Process Steps

 Business Process Diagrams
Business Process Flow Diagrams solution extends the ConceptDraw DIAGRAM BPM software with RapidDraw interface, templates, business process diagrams examples and numerous libraries based on the BPMN 1.2 and BPMN 2.0 standards, which give you the possibility to visualize equally easy simple and complex processes, design business models, quickly develop and document in details any business processes on the stages of project’s planning and implementation.
Business Process Diagrams
Business Process Flow Diagrams solution extends the ConceptDraw DIAGRAM BPM software with RapidDraw interface, templates, business process diagrams examples and numerous libraries based on the BPMN 1.2 and BPMN 2.0 standards, which give you the possibility to visualize equally easy simple and complex processes, design business models, quickly develop and document in details any business processes on the stages of project’s planning and implementation.
The Best Tool for Business Process Modeling

Basic of Flowchart: Meaning and Symbols


Database Flowchart Symbols

How to Help Customers be More Productive

Flow Chart Symbols

Business process Flow Chart — Event-Driven Process chain (EPC) diagrams
 diagrams *")
 Event-driven Process Chain Diagrams
Event-Driven Process Chain Diagrams solution extends ConceptDraw DIAGRAM functionality with event driven process chain templates, samples of EPC engineering and modeling the business processes. It includes a vector shape library for drawing the EPC diagrams and EPC flowcharts of any complexity. It is one of EPC IT solutions that assist the marketing experts, business specialists, engineers, educators and researchers in resources planning and improving the business processes using the EPC flowchart or EPC diagram. Use the EPC solutions tools to construct the chain of events and functions, to illustrate the structure of a business process control flow, to describe people and tasks for execution the business processes. Apply it to identify the inefficient business processes in the enterprise and take the corresponding measures required to make them efficient.
UML Collaboration Diagram (UML2.0)
 *")

- Flowchart | Account Flowchart . Flowchart Examples | Process ...
- Basic Flowchart Symbols and Meaning | Account Flowchart ...
- Login and registration processing | Flowchart
- Accounting Information Systems Flowchart Symbols | | Flowchart For ...
- Account Flowchart . Flowchart Examples | Process Flowchart | How ...
- Business process Flow Chart — Event-Driven Process chain (EPC ...
- Flowchart | UML Use Case Diagram Example Registration System ...
- Event-driven Process Chain Diagrams | Customer Login Flowchart
- Contoh Flowchart | Flowchart | Account Flowchart . Flowchart ...
- Flowchart | Flowchart Components | Login Flow Chart Sample