Made with
ConceptDraw
DIAGRAM 18

Business process Flow Chart —
Event-Driven Process chain (EPC) diagrams

Event-Driven Process Chain (EPC)

A flowchart called “event-driven process chain” (also known as simply “EPC”) is used for modelling the business processes, configuring a so-called “enterprise resource planning” implementation as well as for improving the business processes. The usage for controlling the work share, including controlling the instances of the autonomous workflows, is possible in so-called “workflow management”, but they are not yet implemented.

The “event-driven process chain” method was developed by Mr. Scheer in the early 1990s for laying out the business process workflows. This method can be used by many different companies for the purpose of modelling, analyzing and redesigning any business processes going on within this business field of activity. Both events and functions mentioned in such “event-driven process chain” graph provide many different connectors, letting the business processes execute in an alternative and parallel way. There are no restrictions appearing to exist on the structures of EPCs, but non-trivial structures can involve parallelism and have ill-defined execution semantics. Once they are as we described, then they resemble “UML activity diagrams”.

There are many elements which are used in the “event-driven process chain diagrams”, which are “events” (passive elements that describe under what circumstances a function or a process works or which state a function or a process results in), “functions” (active elements that model the tasks or the activities within one company and also describe the transformations from an initial state to a resulting state), “Organization units” (determine which organization within the structure is responsible for which function), “logical connectors” (show the logical relationships between elements in the control flow) and many other.

There are in total three kinds of logical relationships, which are defined in event-driven process chains. One of these relationships is called “Branch and Merge”: it is used when there is a need to make a decision of which path to choose among a few control flows. A branch may have one control flow (which is usually incoming) as well as two or more so-called “outgoing” control flows. In case this condition is fulfilled, a branch activates only one of the “outgoing” control flows and it also deactivates the others. The counterpart of a branch is a “merge”, which may have two or more “incoming” flows and one “outgoing” control flow.

Another kind of relationships within a logical structure can be “Fork and Join” correspond which is meant to be used for activating all paths in the control flow. A “fork” may have only one incoming control flow as well as two or more outgoing control flows. Once the condition within “Fork and Join” correspond relationship is fulfilled, then a “fork” activates all of the “outgoing control flows” which go in parallel to each other. A join may have two or more “incoming control flows” as well as one “outgoing control flow”. In the “Event-driven Process Chain diagram” it never matters in what way the concurrency is achieved. A “fork” in the EPC is represented by an opening “AND” connectors and a “join” is represented as a closing “AND” connectors.

The third kind of relationships is “OR”, which corresponds for activating one or more paths among the control flows. An opening “OR” connector may have one “incoming control flow” and more than one “outgoing control flows”. Once the condition is fulfilled, an opening “OR” connector activates one or more control flows and it deactivates the rest of them. The counterpart to it is the closing “OR” connector. Once at least one of the “incoming control flows” is activated, then the closing “OR” connector will pass the control to the next element after it.

A “control flow” is another kind of relationships and it is used for connecting the events with functions, process paths or logical connectors creating a chronological sequence as well as logical interdependencies between them. A “control flow” is usually represented as a dashed arrow. “Information flows” though show the connection between functions as well as “input” or “output” of data. “Organization unit assignments” are the kind of relationship that shows the connection between an organization unit and the function it is responsible for.

The “Process paths” as a kind of relationship can be used as navigation aid within the event-driven process chain. These “Process paths” are there for showing the connection from (or to) other processes. This “process path” relationship is represented as a compound symbol, which is composed of a “function symbol” superimposed upon another so-called “event symbol”. In order to employ the “process path” symbol in an “event-driven process chain diagram”, a symbol has to be connected to the “process path” symbol, indicating the process being diagrammed incorporating the entirety of a second process. This second process is usually, for a purpose of a diagrammatic simplicity, is represented by a single symbol.

Event-Driven Process Chain (EPC)

Pic. 1. Event-Driven Process Chain (EPC)

You can create event-driven process chain diagrams with the help of many different applications, but the best tool is ConceptDraw DIAGRAM software extended with “EPC” Solution. Making “event-driven process chain diagram” with the aid of Data Flow Diagrams solution, which can be found in the Software Development area of ConceptDraw Solution Park on this site and so downloaded from as well as in ConceptDraw STORE, which is a new product of CS Odessa. ConceptDraw DIAGRAM application is always very simple in use and the process of creating such diagram will appear to be fun and entertaining as you will have all of the necessary tools for making great looking diagrams, such as templates and examples to simplify your work of drawing smart and professionally looking event-driven process chain diagrams.

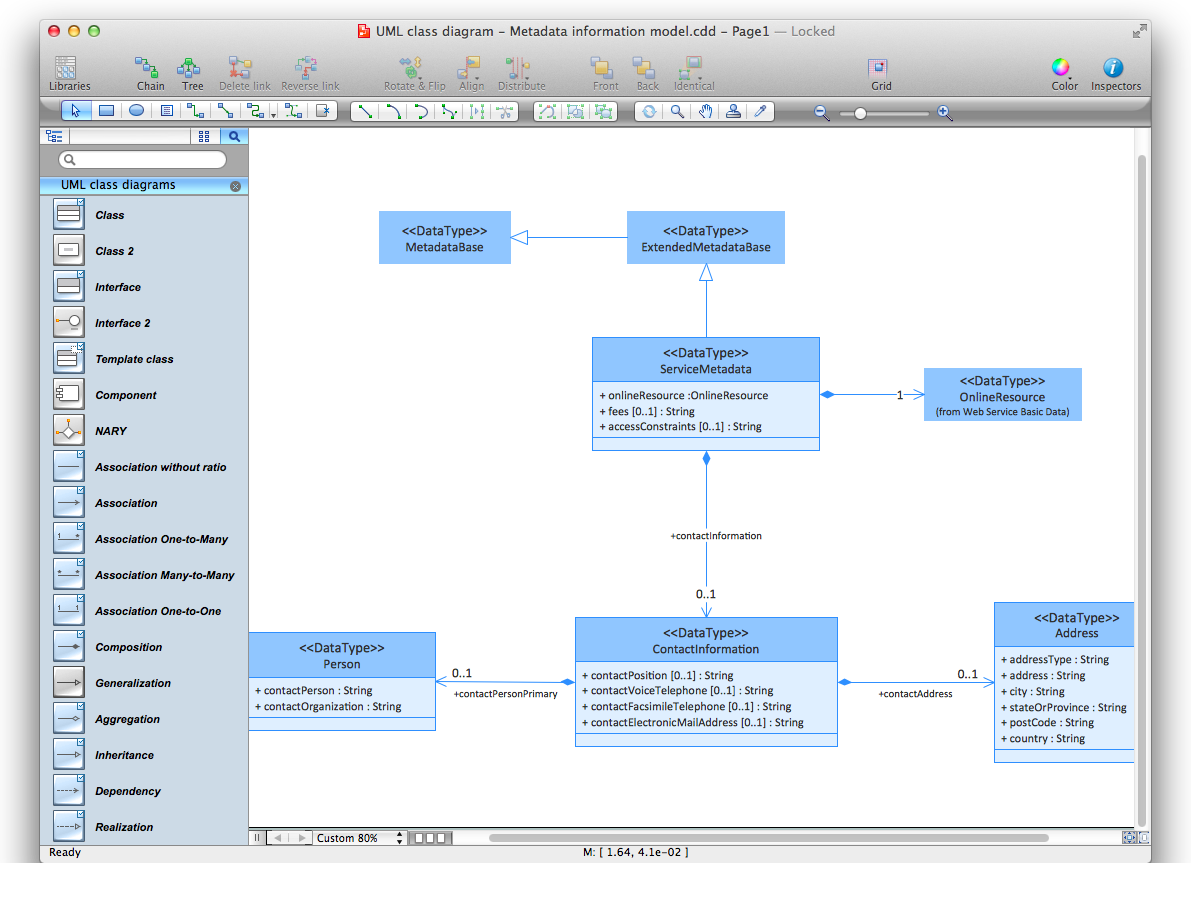
ConceptDraw DIAGRAM is a software for making business process flowcharts diagrams. The Event-driven Process Chain (EPC) Diagrams allows managers visually present business process models for making decisions for business.

The EPC is able to cope with extremely diverse and complex businesses processes. EPC diagram as a result can represent the various elements in a way which is easy to understand. A Process Flow Diagram tabulates process components' structure values in various real modes.

Business process Flow Chart — <br>Event-Driven Process chain (EPC) diagrams *

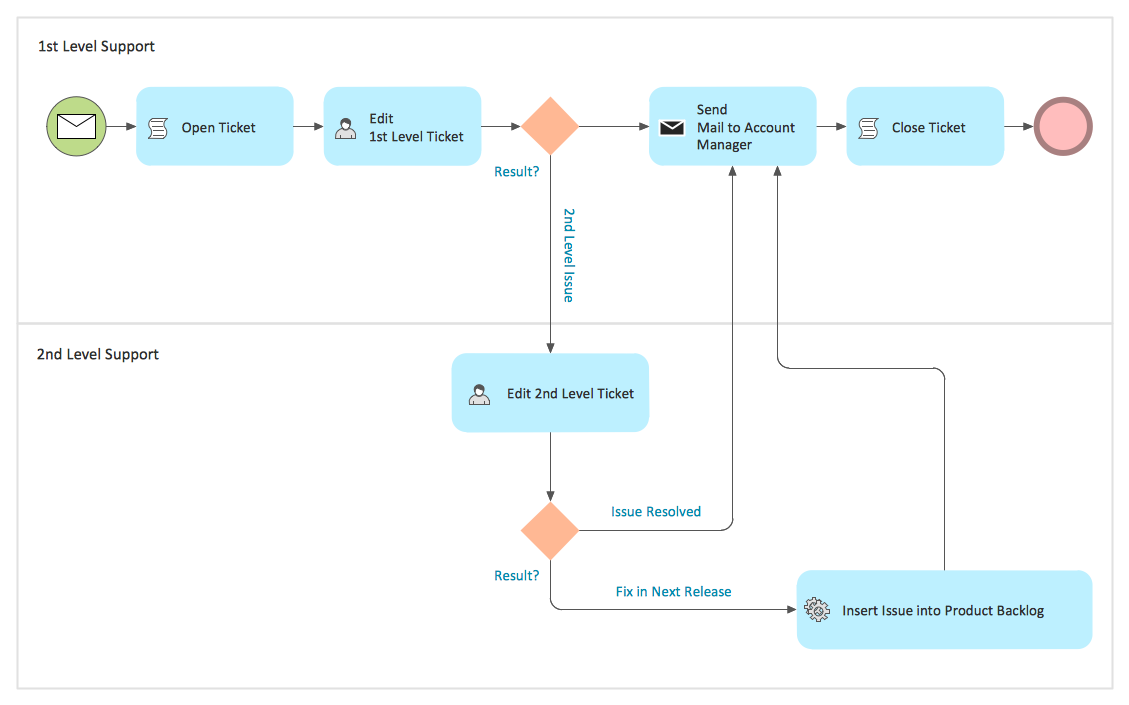
Pic. 2. Business process Flow Chart Tool — Event-Driven Process chain (EPC) diagram, Process flow diagram tool

Event-driven Process Chain Diagrams EPC solution contains also a set of different examples and templates. All EPC diagram samples and templates are available from ConceptDraw STORE, you can open them and change something as needed, and thus get already your own new EPC diagram

.

Login and registration processing - EPC diagram

Pic. 3. Login and registration processing — EPC diagram.

The Event-driven Process Chain Diagrams solution extends ConceptDraw DIAGRAM software with EPC templates, samples, and vector shape library for the drawing of EPC business process flowcharts.

EPC solution

Pic. 4. Event-Driven Process chain (EPC) solution

The Event-driven Chain Diagrams solution assists in the planning of resources and improves business processes using EPC flowcharts.


TEN RELATED HOW TO's:
Rack Diagrams visualize the rack mounting of computer and network equipment as the drawing of frontal view of the rack with equipment installed. They are used for choosing the equipment or racks to buy, and help to organize equipment on the racks virtually, without the real installation. Network Diagramming Software - ConceptDraw DIAGRAM is perfect for software designers and software developers who need to draw Rack Diagrams.Network Diagramming Software for Design<br>Rack Diagrams *
Picture: Network Diagramming Software for DesignRack Diagrams
Related Solution:
Nowadays, more and more attention is paid to the comfort in the workplace, so that employees might be more motivated. Thus, it can be said with full confidence that office layout plays an important role for employees and influences company reputation. Many worldwide known companies have headquarter offices resembling more of a campus than of an office building. Every organization has its own unique office design ideas, needs and requirements. Each of office position requires a certain type of person who has his own requirements, needs and habits. Office layout should be designed to facilitate its business function. The well-organized office space plays an important role in a workflow enhancement and productivity improvement. This office layout diagram demonstrates a typical cubical office layout. This diagram can be use as a template for cubicle office layout organization. This visual example can help shape ideas and design your office layout conception. You can start with adding your requested office furniture objects into your office floor plan. Plants help to create a healthy indoor environment. You can design an office space that totally fits your needs.Office Layout
Picture: Office Layout
Related Solution:
The knowledge and ability to apply various strategies for dealing with problems and difficult situations is very useful in many areas. The Fishbone strategy is one of the most progressive. This graphical technique helps to identify possible causes of problems, to set the goals, and also show internal connections between the different parts of problem. After reviewing all causes and facts, you can easily find right solution. ConceptDraw DIAGRAM diagramming and vector drawing software extended with Fishbone Diagrams Solution from the Management Area of ConceptDraw Solution Park is a powerful Fishbone Problem Solving tool.Fishbone Problem Solving *
Picture: Fishbone Problem Solving
Related Solution:
One of the most visible trends in today's information technology (IT) industry is the placement of databases to the cloud. Microsoft Azure is one of such useful cloud services which is quite popular among applications developers and offers them extensive and effective Azure management tools. ConceptDraw DIAGRAM diagramming and vector drawing software enhanced with Azure Architecture Solution from the Computer and Networks area of ConceptDraw Solution Park offers all needed tools for designing Azure management illustrations and Azure Architecture Diagrams.Azure Management *
Picture: Azure Management
Related Solution:
ConceptDraw RapidDraw DIAGRAM helps create visually document and communicate Business Process (BPMN 2.0) information.Business Process Modeling *
Picture: Business Process Modeling
Electrical plan is a document that is developed during the first stage of the building design. This scheme is composed of conventional images or symbols of components that operate by means of electric energy. To simplify the creation of these schemes you can use house electrical plan software, which will not require a long additional training to understand how to use it. You only need to install the necessary software ant it’s libraries and you’ll have one less problem during the building projection. Any building contains a number of electrical systems, including switches, fixtures, outlets and other lightening equipment. All these should be depicted in a building electrical plans and included to general building documentation. This home electrical plan displays electrical and telecommunication devices placed to a home floor plan. On the plan, each electrical device is referenced with the proper symbol. Electrical symbols are used for universal recognition of the building plan by different persons who will be working on the construction. Not all possible electric symbols used on a certain plan, so the symbols used in the current home plan are included to a legend. The electrical home plan may be added as a separate document to a complete set of building plans.House Electrical Plan Software
Picture: How To use House Electrical Plan Software
Related Solution:
Website wireframe is a detailed view of design or its skeleton. It shows all the important elements of the final website, the main groups of contents, information structure, describes the user's interaction with interface and its estimated visualisation. ConceptDraw DIAGRAM extended with Website Wireframe solution from the Software Development area is the best wireframing software. Using the wireframe tools, libraries of vector objects, template and examples which offers a Website Wireframe solution, you will easily design the websites wireframes of any complexity.Wireframing *
Picture: Wireframing
Related Solution:
ConceptDraw DIAGRAM - business process modeling software for mac offers the Business Process Diagram Solution with powerful tools to help you easy represent the business processes and create the business process diagrams based on BPMN 1.2 and BPMN 2.0 standards that allows to create of both simple and complex (nested) models of processes. There are 16 BPMN 1.2 and BPMN 2.0 stencil libraries containing 230 vector objects: Rapid Draw library, Connections library, Gateways and Artifacts libraries, Data library, Gateways library, Choreographies library, Conversations library, Activities libraries, Events libraries, Expanded Objects libraries, Swim lanes libraries.Business Process Modeling Software for Mac *
Picture: Business Process Modeling Software for Mac
Related Solution:
Sometimes it’s quite useful to look on a problem from another view. To gain insight into an obstacle you should use SWOT analysis, and this will help you to see the whole situation. When composing a SWOT matrix, you divide your problem onto four elements - strengths, weaknesses, opportunities and threats and place them into matrix. This sample SWOT analysis matrix of the athletic shoes producing company was designed on the base of template provided by ConceptDraw SWOT and TOWS Matrix Diagrams solution. It delivers number of easy-to-use templates and samples of SWOT and TOWS matrices for ConceptDraw DIAGRAM. Applying one of these templates, enables to quickly find out Strengths, Weaknesses, Opportunities, and Threats. After creating a list managers can consider methods the business can use to amplify strengths and to decrease weaknesses; realize opportunities; and avoid threats.SWOT Analysis *
Picture: SWOT Analysis
Related Solution:
Design efficiently the technical flow charts in ConceptDraw DIAGRAM software for various fields and provide ✔️ clarity, ✔️ accuracy, ✔️ usability, ✔️ simple communication, analysis, and improvementTechnical Flow Chart Example Design in ConceptDraw DIAGRAM
Picture: Technical Flow Chart Example
Related Solution:
ConceptDraw
DIAGRAM 18