Process Flowchart


"A project manager is the person responsible for accomplishing the stated project objectives. Key project management responsibilities include creating clear and attainable project objectives, building the project requirements, and managing the constraints of the project management triangle, which are cost, time, scope, and quality.
A project manager is often a client representative and has to determine and implement the exact needs of the client, based on knowledge of the firm they are representing. A project manager is the bridging gap between the production team and client. So he/ she must have a fair knowledge of the industry they are in so that they are capable of understanding and discussing the problems with either party. The ability to adapt to the various internal procedures of the contracting party, and to form close links with the nominated representatives, is essential in ensuring that the key issues of cost, time, quality and above all, client satisfaction, can be realized.
The term and title 'project manager' has come to be used generically to describe anyone given responsibility to complete a project. However, it is more properly used to describe a person with full responsibility and the same level of authority required to complete a project. If a person does not have high levels of both responsibility and authority then they are better described as a project administrator, coordinator, facilitator or expeditor." [Project manager. Wikipedia]
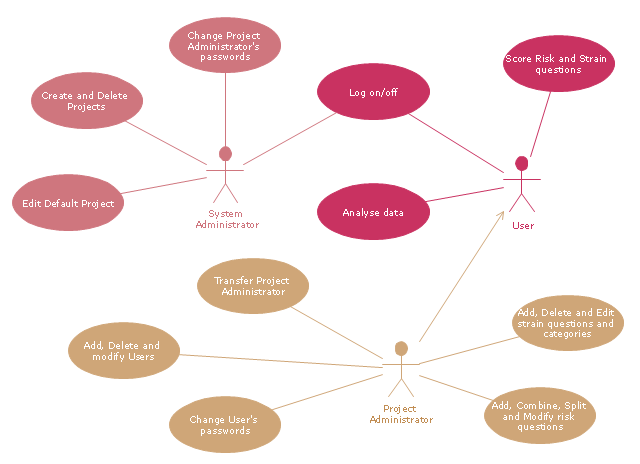
The UML use case diagram example "Project administrator" was created using the ConceptDraw PRO diagramming and vector drawing software extended with the Rapid UML solution from the Software Development area of ConceptDraw Solution Park.
A project manager is often a client representative and has to determine and implement the exact needs of the client, based on knowledge of the firm they are representing. A project manager is the bridging gap between the production team and client. So he/ she must have a fair knowledge of the industry they are in so that they are capable of understanding and discussing the problems with either party. The ability to adapt to the various internal procedures of the contracting party, and to form close links with the nominated representatives, is essential in ensuring that the key issues of cost, time, quality and above all, client satisfaction, can be realized.
The term and title 'project manager' has come to be used generically to describe anyone given responsibility to complete a project. However, it is more properly used to describe a person with full responsibility and the same level of authority required to complete a project. If a person does not have high levels of both responsibility and authority then they are better described as a project administrator, coordinator, facilitator or expeditor." [Project manager. Wikipedia]
The UML use case diagram example "Project administrator" was created using the ConceptDraw PRO diagramming and vector drawing software extended with the Rapid UML solution from the Software Development area of ConceptDraw Solution Park.
UML use case diagram
Using Fishbone Diagrams for Problem Solving

Flow chart Example. Warehouse Flowchart


Bar Diagrams for Problem Solving. Create event management bar charts with Bar Graphs Solution

Types of Flowcharts


SWOT Analysis

When To Use a Fishbone Diagram

What is SWOT Analysis?

Basic Diagramming


UML Use Case Diagrams


Bar Diagrams for Problem Solving. Create manufacturing and economics bar charts with Bar Graphs Solution

Critical Path Method in ConceptDraw PROJECT

Influence Diagram Software

Software for Creating SWOT Analysis Diagrams

- Fishbone Diagram Example For Service Industry
- Result Analysis Diagram Service Industry
- How To use House Electrical Plan Software | Electrical Drawing ...
- Block Diagram Of Software Project Management
- Fishbone Diagram Problem Solving | Using Fishbone Diagrams for ...
- Activities In A Project Management Software With Example Diagram
- Project Network Diagram Example Of Software Project
- Block diagram - Porter's five forces model | Project Management ...
- Draw A Flow Chart To Show The Primary Sector Of Any Good The ...
- Service Process Mapping Project In Automobile Industry
- Industry Analysis Diagram
- Block Diagram Of Project Management
- Block Diagrams For A Project On Website Design
- Activities Industry Diagram
- Competitor Analysis | Block diagram - Porter's five forces model ...
- Industry Marketing Diagrams
- UML Class Diagram Generalization Example UML Diagrams | UML ...
- Process Flowchart | How To Create Onion Diagram | Onion Diagram ...
- Bar Diagrams for Problem Solving. Create manufacturing and ...
- Quality Control Diagram Industry Hd Photos