Block Diagram

 Block Diagrams
Block diagrams solution extends ConceptDraw PRO software with templates, samples and libraries of vector stencils for drawing the block diagrams.
Network Diagram Software LAN Network Diagrams & Diagrams for LAN Physical Office Network Diagrams


HelpDesk
How to Draw a Pyramid Diagram in ConceptDraw PRO

Star Network Topology


Process Flowchart


Network Topology Illustration

Functional Block Diagram

Daisy Chain Network Topology

Local area network (LAN). Computer and Network Examples
. Computer and Network Examples")
 Pyramid Diagrams
Pyramid Diagrams solution extends ConceptDraw PRO software with templates, samples and library of vector stencils for drawing the marketing pyramid diagrams.
Block Diagram Software

UML Component Diagram. Design Elements
")

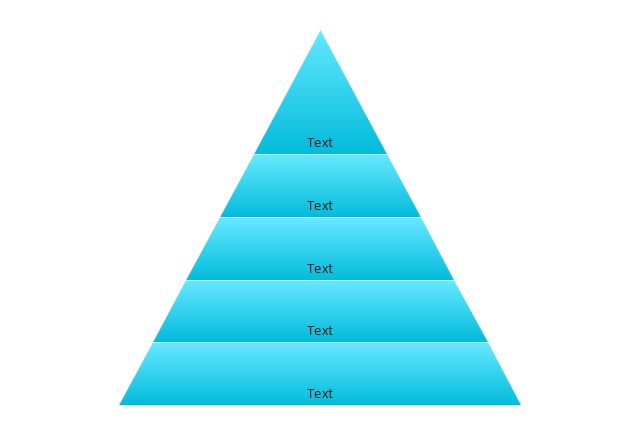
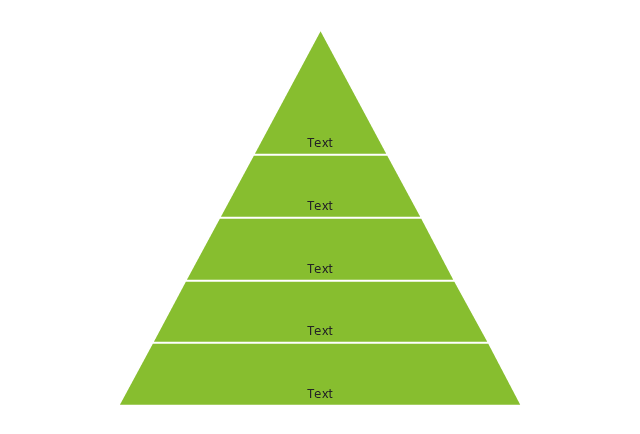
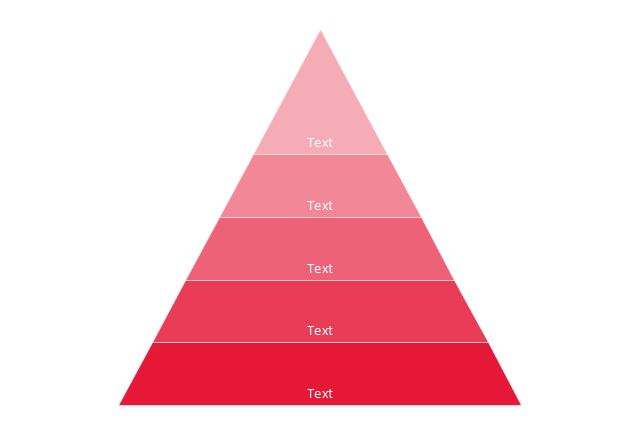
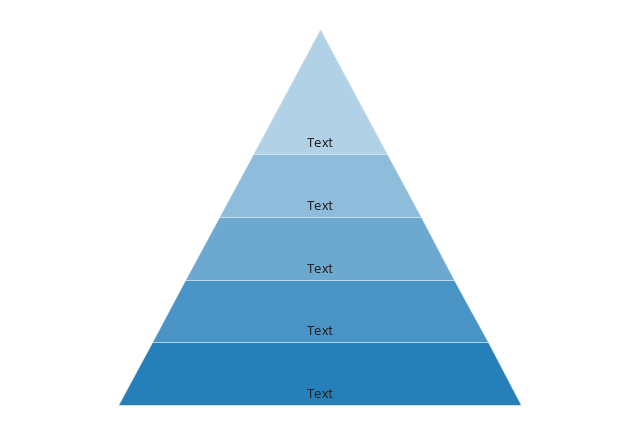
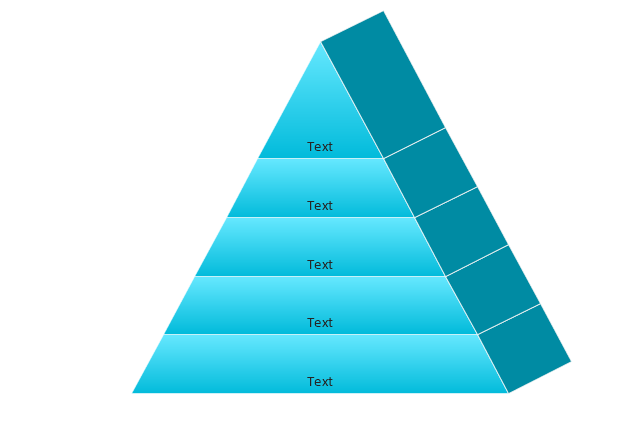
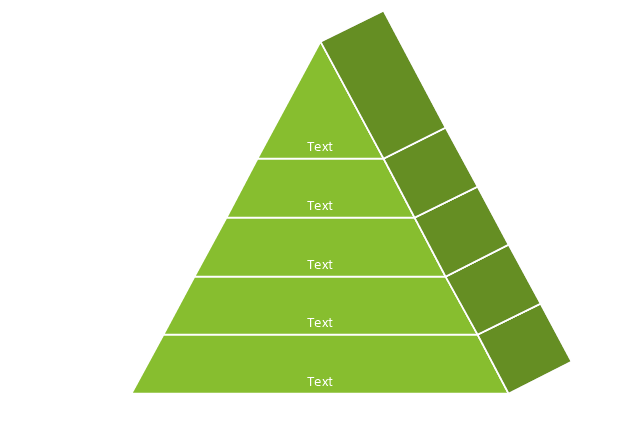
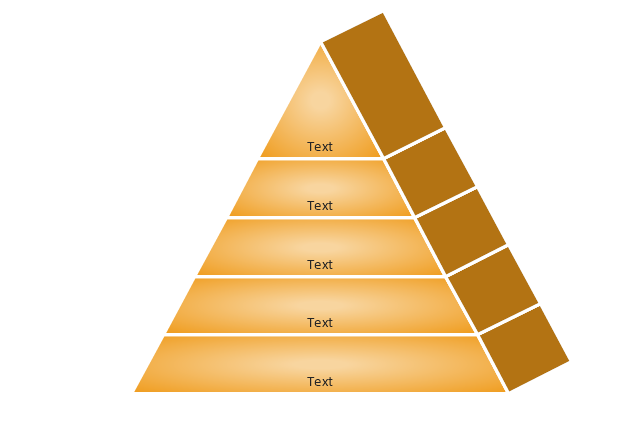
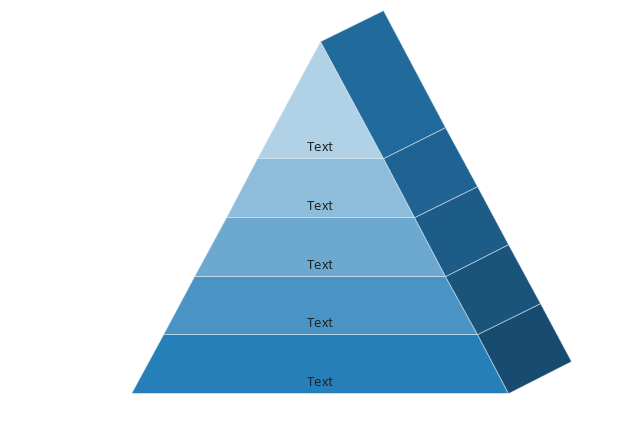
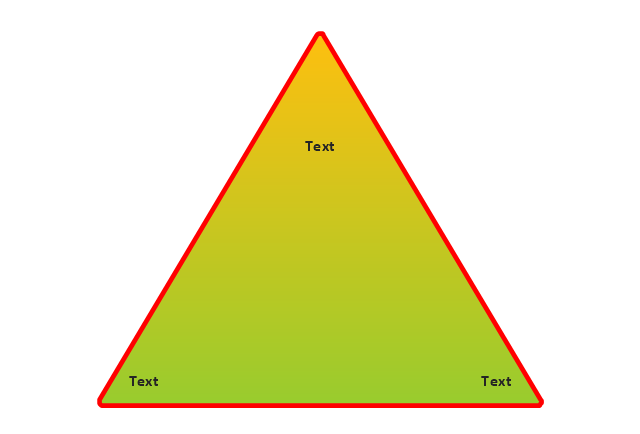
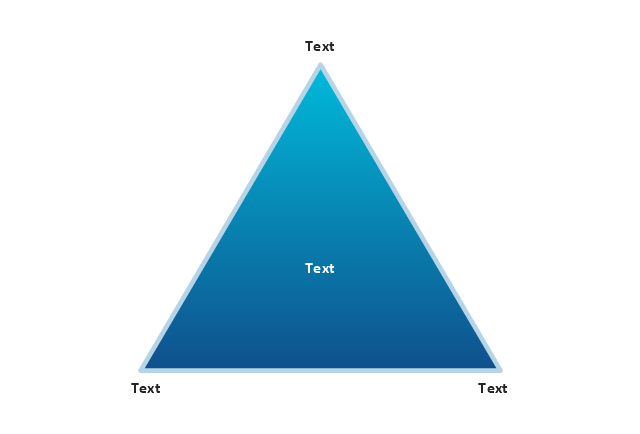
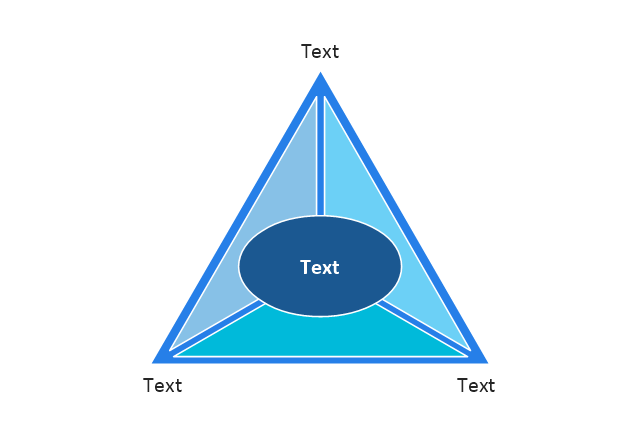
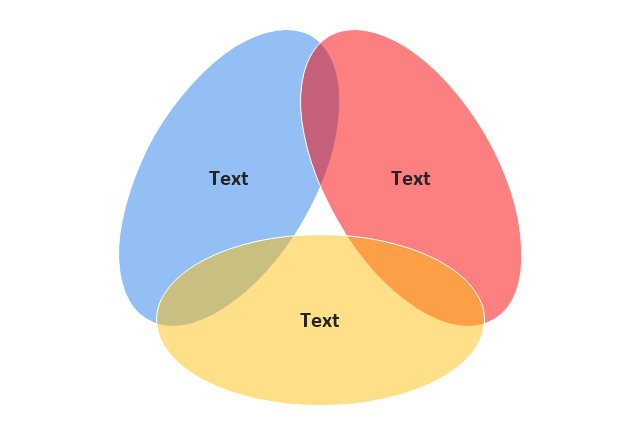
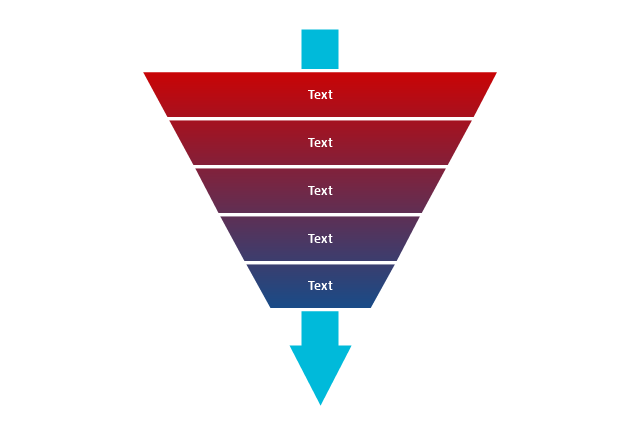
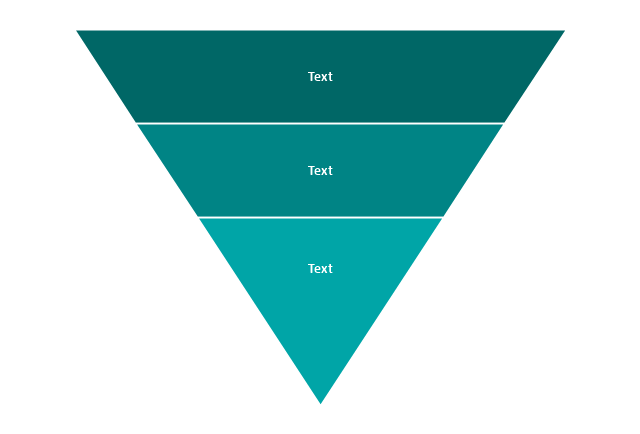
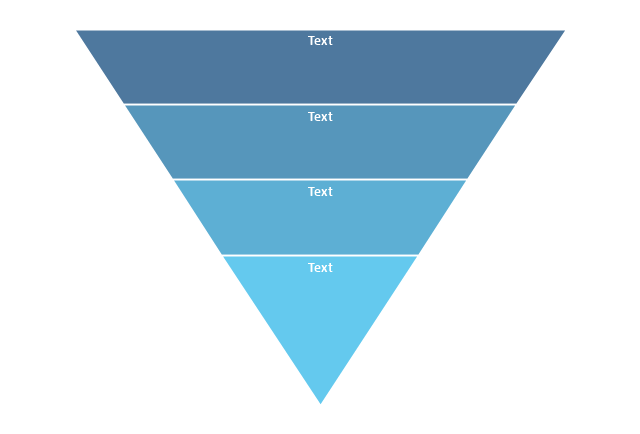
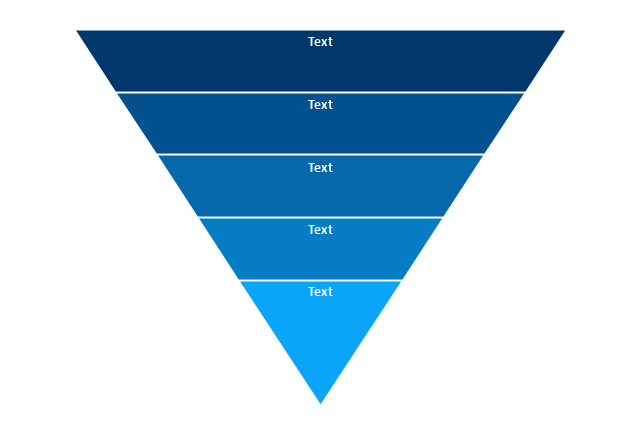
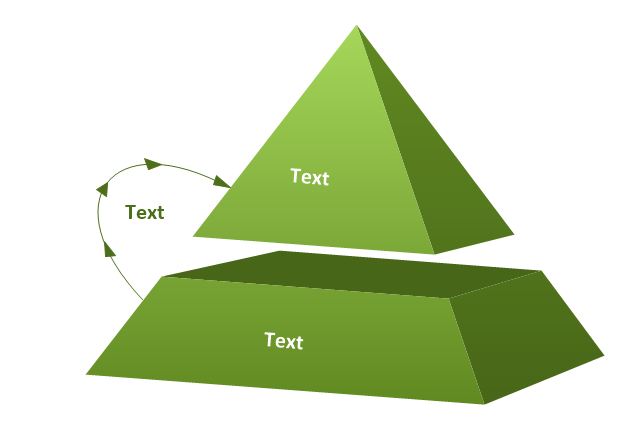
The vector stencils library "Pyramid diagrams" contains 28 templates of pyramid diagrams, triangle charts and triangular schemes.
Use these templates to create your pyramid diagrams in the ConceptDraw PRO diagramming and vector drawing software extended with the Pyramid Diagrams solution from the Marketing area of ConceptDraw Solution Park.
Use these templates to create your pyramid diagrams in the ConceptDraw PRO diagramming and vector drawing software extended with the Pyramid Diagrams solution from the Marketing area of ConceptDraw Solution Park.
Pyramid 1
Pyramid 2
Pyramid 3
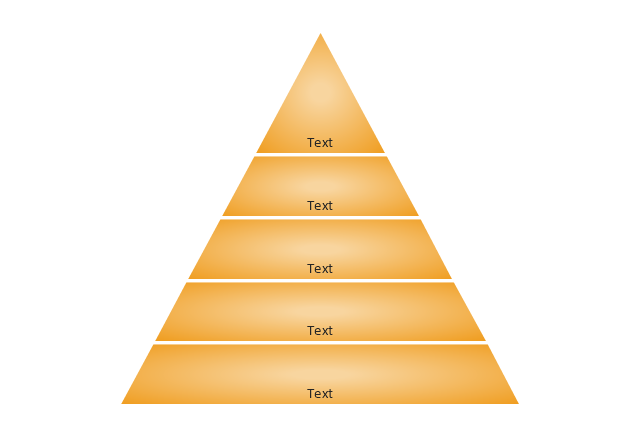
Pyramid 4
Pyramid 5
Pyramid 1 Isometric
Pyramid 2 Isometric
Pyramid 3 Isometric
Pyramid 4 Isometric
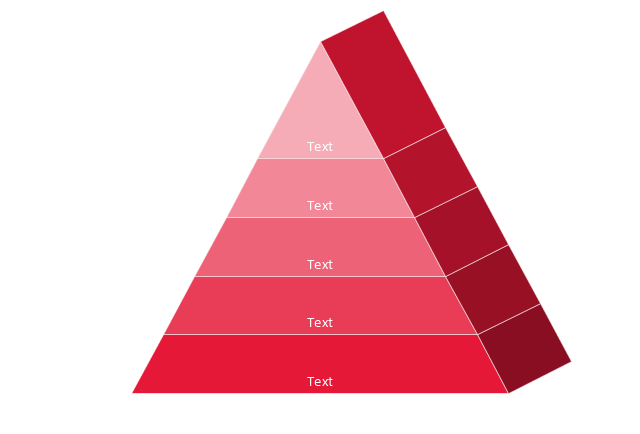
Pyramid 5 Isometric
Triangle diagram, arrows
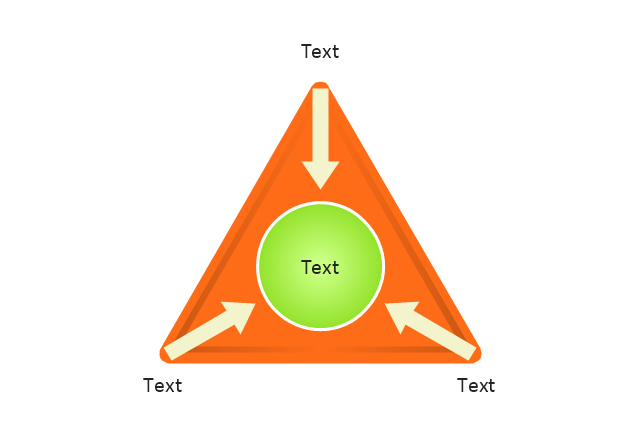
Triangle diagram
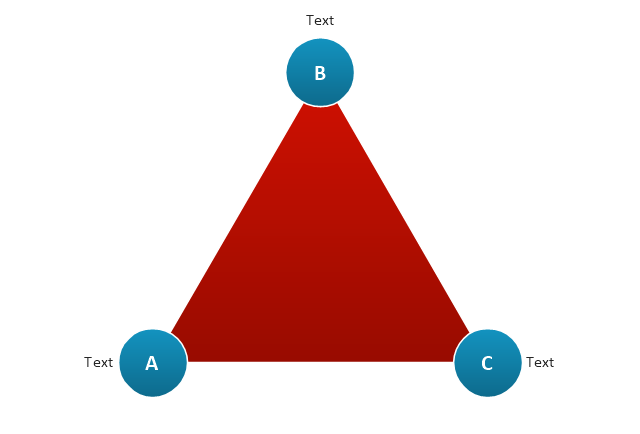
Triangular pyramid
Triangular diagram
Triangle scheme
Triangle chart

Triangle chart, isometric

Triangular scheme
Arrowed block pyramid

Funnel diagram
3-level funnel diagram
4-level funnel diagram
5-level funnel diagram
2-level pyramid diagram
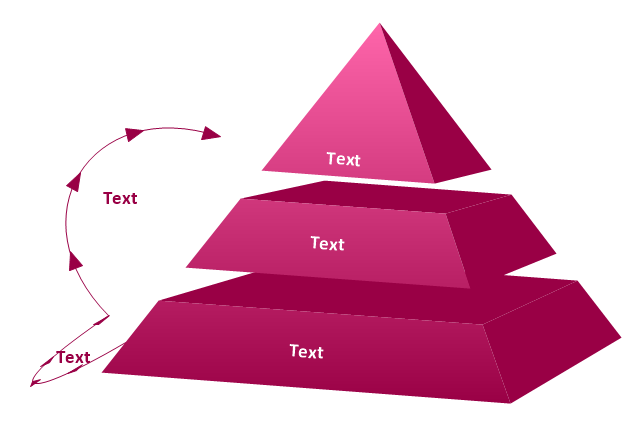
3-level pyramid diagram
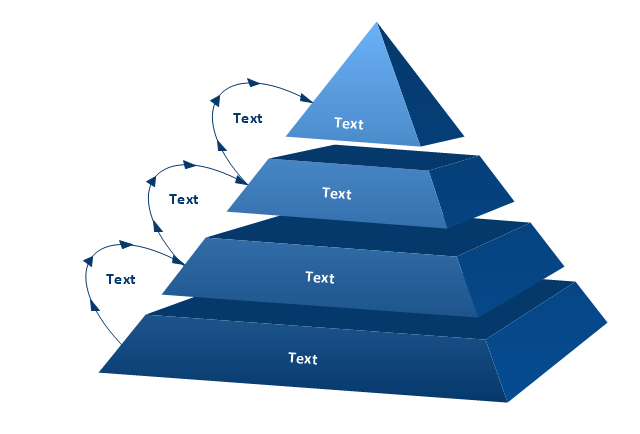
4-level pyramid diagram
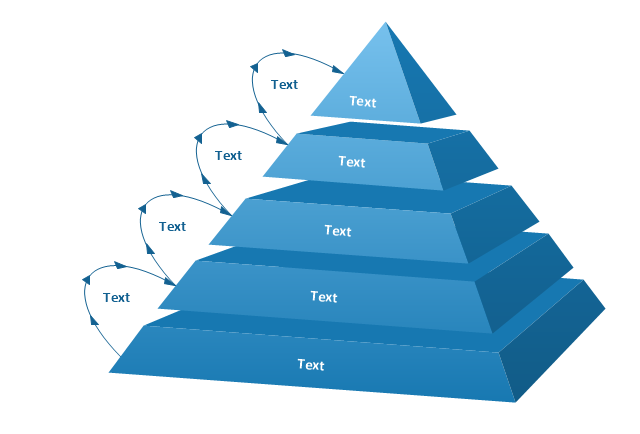
5-level pyramid diagram
6-level pyramid diagram

HelpDesk
How to Create a Bar Chart in ConceptDraw PRO

- Functional Block Diagram | Basic Diagramming | Block Diagram ...
- Block Diagram Of 3d Oragnisation
- 3D Block diagram - Template | Block Diagram | Basic Diagramming ...
- Block Diagram | 3D Block diagram - Template | Basic Diagramming ...
- 3D Network Diagram Software | Pyramid Diagram | Directional Maps ...
- 3D Block diagram - Template | Basic Diagramming | Block Diagrams ...
- 3d Block Diagram
- 3D Network Diagram Software | Pyramid Diagram | 3D Triangle ...
- Block Diagram 3d Map
- Block Diagram | Basic Diagramming | Directional Maps | 3d Mapping ...
- Computer 3d Blog Diagram
- Building Management System Schematic Diagram In 3d
- Basic Diagramming | Block Diagrams | Illustration Area | How To ...
- Pyramid Diagram | 3D Triangle diagram - Template | How to Create ...
- Computer Systems 3d Schematic Block
- 3d Workflow Diagram
- Block Diagrams | Directional Maps | Pyramid Diagrams | How To ...
- Block Diagram Of Computer In 3d
- Pro Engineering 3d Model Diagram