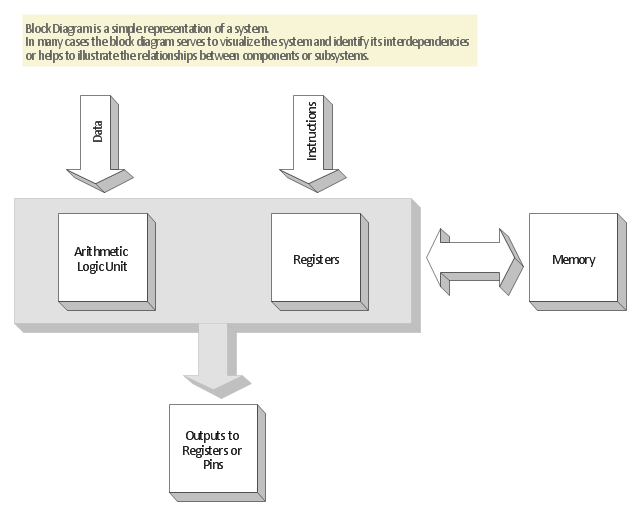
"The block diagram is typically used for a higher level, less detailed description aimed more at understanding the overall concepts and less at understanding the details of implementation. Contrast this with the schematic diagram and layout diagram used in the electrical engineering world, where the schematic diagram shows the details of each electrical component and the layout diagram shows the details of physical construction." [Block diagram. Wikipedia]
The 3D block diagram template for the ConceptDraw PRO diagramming and vector drawing software is included in the Block Diagrams solution from the area "What is a Diagram" of ConceptDraw Solution Park.
The 3D block diagram template for the ConceptDraw PRO diagramming and vector drawing software is included in the Block Diagrams solution from the area "What is a Diagram" of ConceptDraw Solution Park.
3D Block diagram template
 Basic Diagramming
This solution extends ConceptDraw PRO software with the specific tools you need to easily draw flowcharts, block diagrams, histograms, pie charts, divided bar diagrams, line graphs, circular arrows diagrams, Venn diagrams, bubble diagrams and concept maps
 Block Diagrams
Block diagrams solution extends ConceptDraw PRO software with templates, samples and libraries of vector stencils for drawing the block diagrams.
HelpDesk
How to Draw a Histogram in ConceptDraw PRO

 Maps
Maps
This solution extends ConceptDraw PRO v9.4 with the specific tools necessary to help you draw continental, directional, road, or transit maps, to represent international, business, or professional information visually.
 Directional Maps
Directional Maps solution extends ConceptDraw PRO software with templates, samples and libraries of vector stencils for drawing the directional, location, site, transit, road and route maps, plans and schemes.
 Pyramid Diagrams
Pyramid Diagrams solution extends ConceptDraw PRO software with templates, samples and library of vector stencils for drawing the marketing pyramid diagrams.
Storage area networks (SAN). Computer and Network Examples
. Computer and Network Examples")
This example was created in ConceptDraw PRO using the Computer and Networks Area of ConceptDraw Solution Park. It shows the hybrid of Storage area network (SAN) and Network Attached Storage (NAS) technologies.

 Audio, Video, Media
This solution extends ConceptDraw PRO software with samples, templates and library of vector clipart of audio, media, video and photo equipment for drawing the illustrations.
- 3D block diagram template
- Block diagram template | 3D block diagram template | Engineering
- 3D block diagram template | Basic Diagramming | Block Diagrams ...
- 3D Block diagram - Template - Conceptdraw.com
- 3D Network Diagram Software | Pyramid Diagram | 3D block ...
- Basic Diagramming | Block diagram - Six markets model | Block ...
- 3D Block diagram template - Conceptdraw.com
- Basic Diagramming
- Basic Diagramming | 3D Network Diagram Software | Maps ...
- ConceptDraw Solution Park | Block Diagrams | Wireless Network ...
- Network Diagram Examples | Basic Diagramming | Cisco Network ...
- Basic Diagramming | Create Block Diagram | Best Multi-Platform ...
- Block diagram - Five forces model
- 6-level 3D pyramid diagram template | 3D Segmented pyramid chart ...
- Engineering | Electrical Drawing Software | Electrical Diagram ...
- Block Diagrams | IDEF0 standard with ConceptDraw PRO | Block ...
- Engineering | Block Diagrams | Universal Diagramming Area ...
- UML Use Case Diagrams | UML Tool & UML Diagram Examples ...
- Basic Diagramming | Create Block Diagram | The Best Drawing ...
- Block Diagrams | Basic Diagramming | Universal Diagramming Area ...