 Block Diagrams
Block diagrams solution extends ConceptDraw DIAGRAM software with templates, samples and libraries of vector stencils for drawing the block diagrams.
Block Diagram

 Basic Diagramming
This solution extends ConceptDraw DIAGRAM software with the specific tools you need to easily draw flowcharts, block diagrams, histograms, pie charts, divided bar diagrams, line graphs, circular arrows diagrams, Venn diagrams, bubble diagrams and concept maps
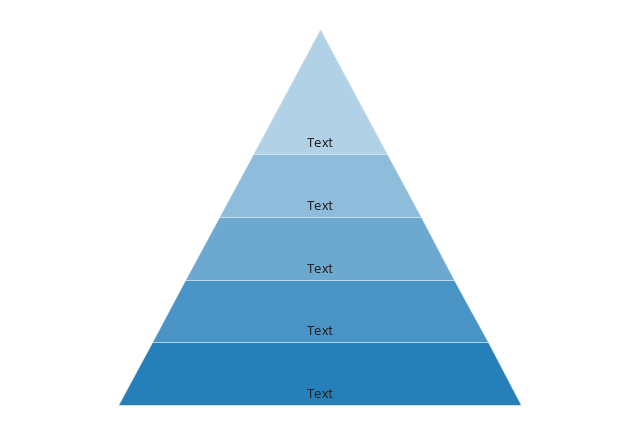
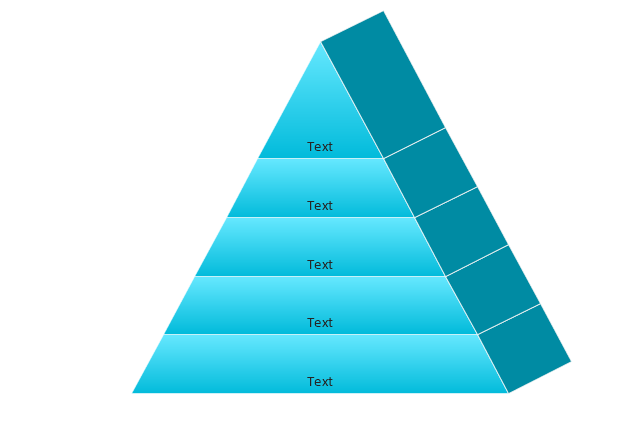
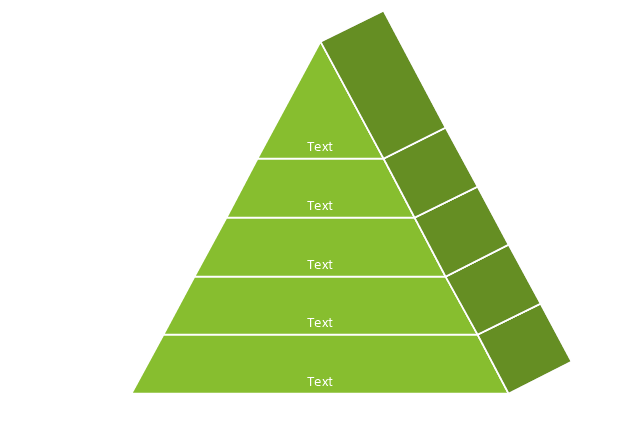
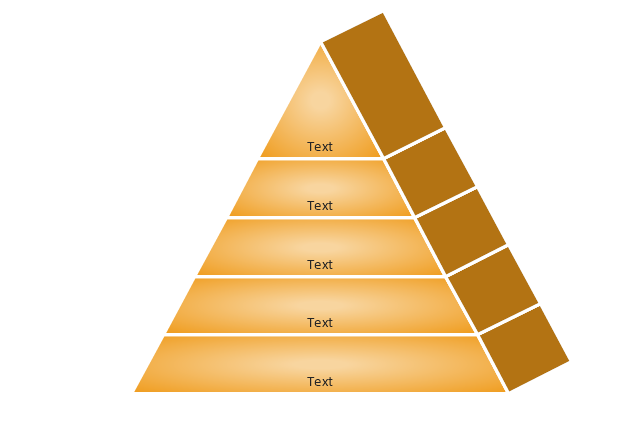
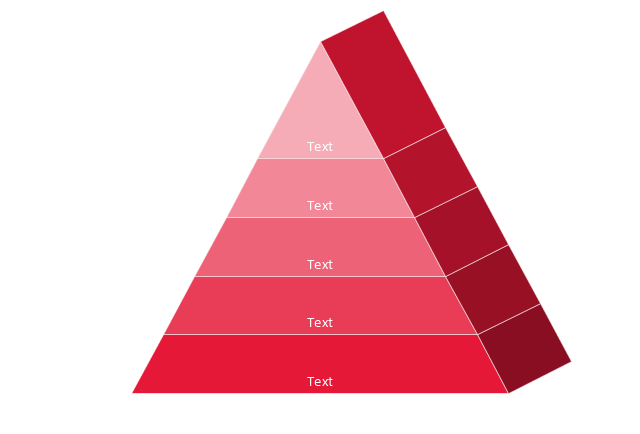
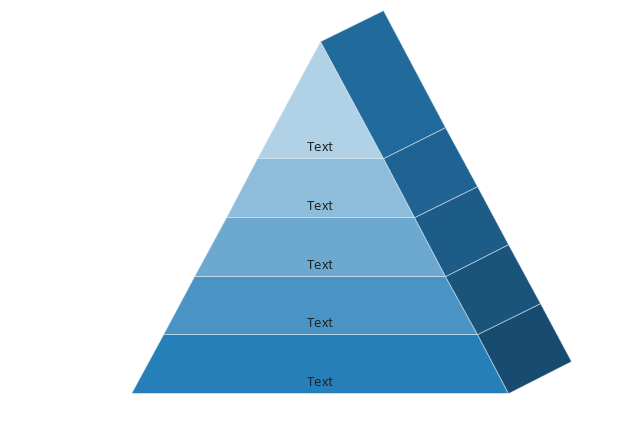
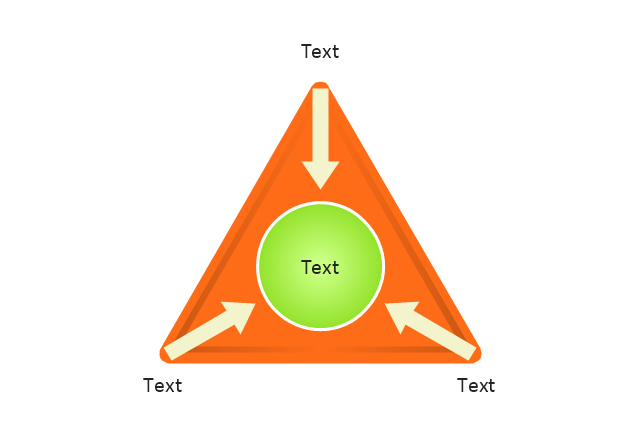
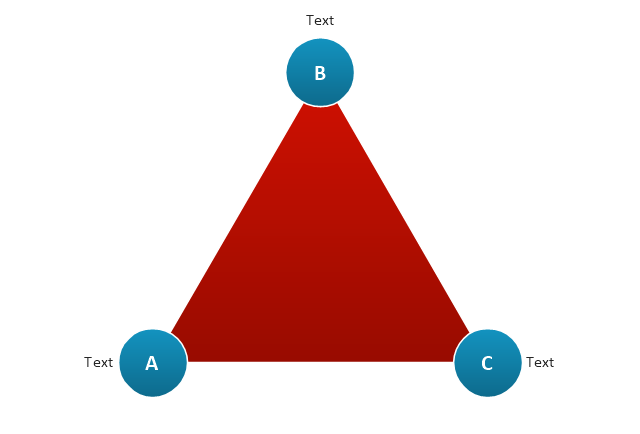
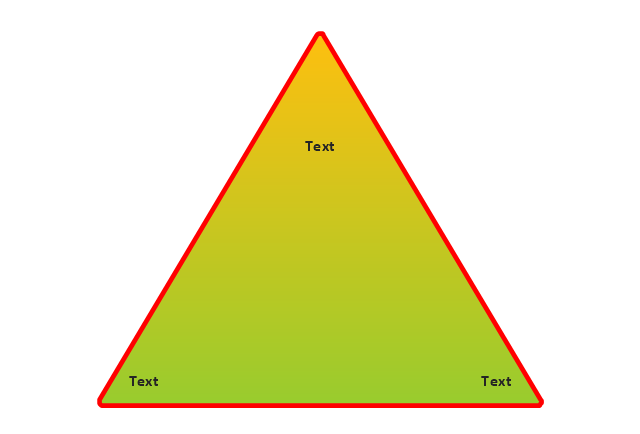
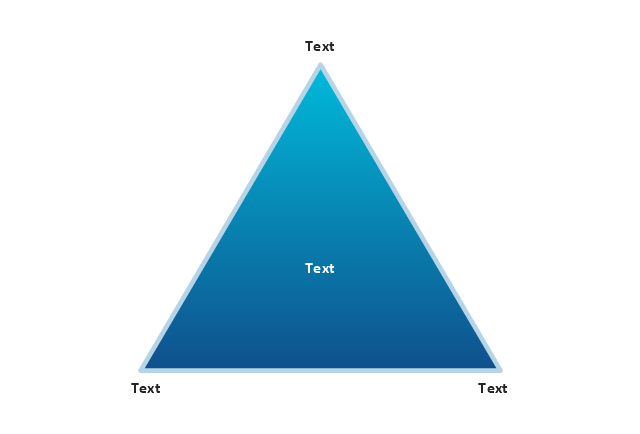
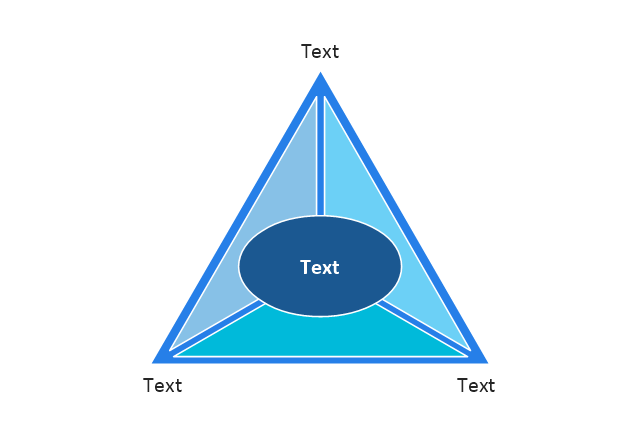
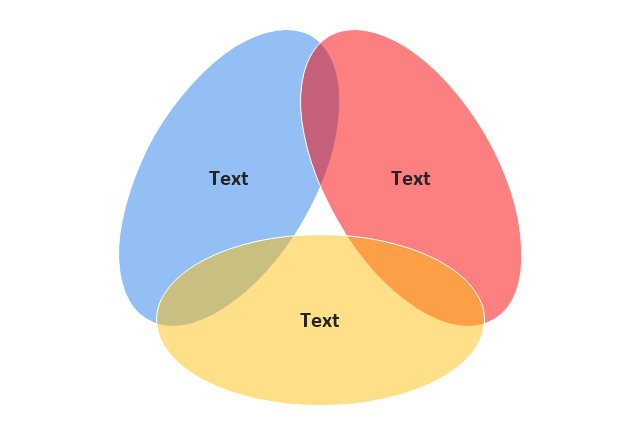
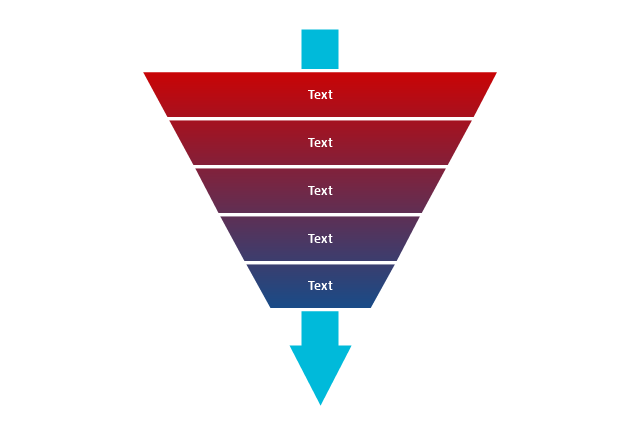
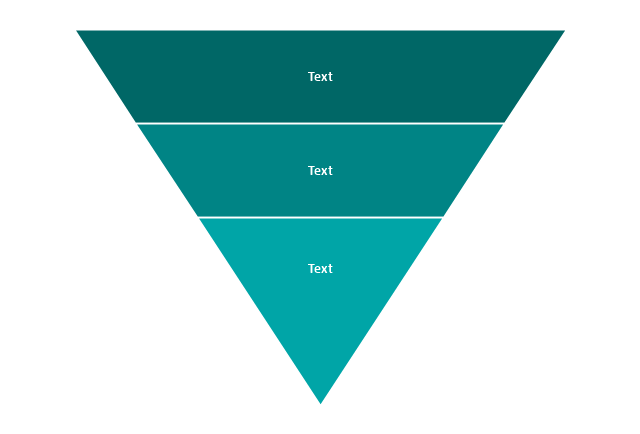
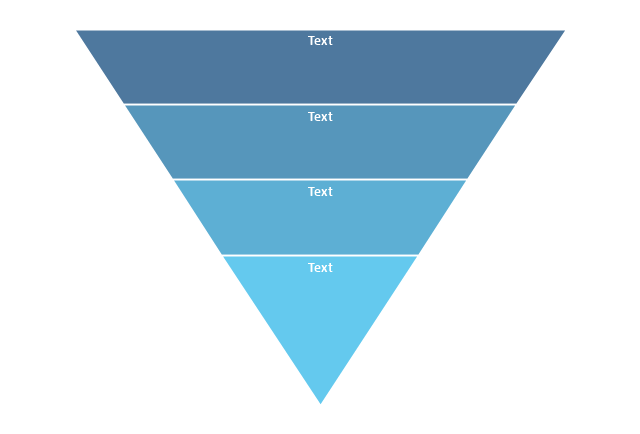
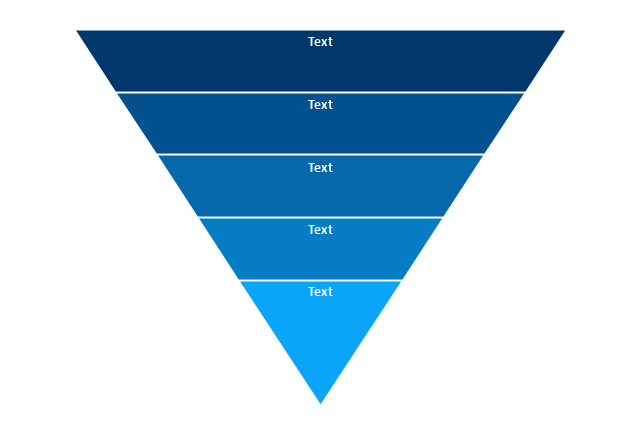
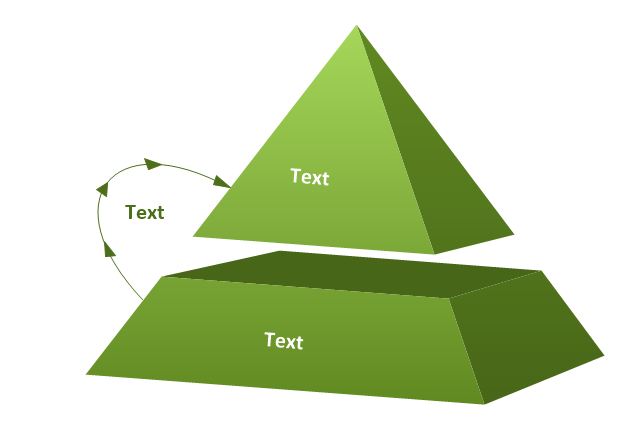
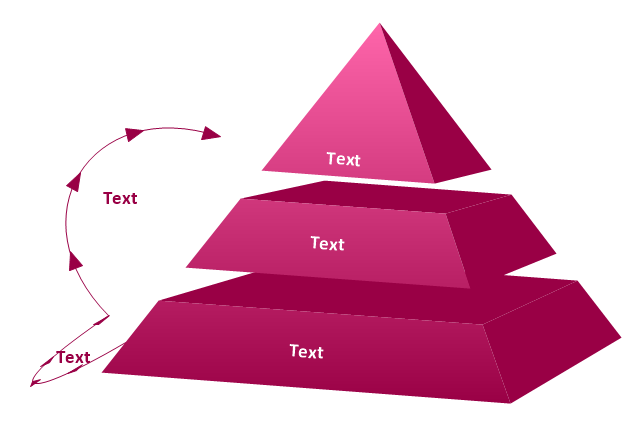
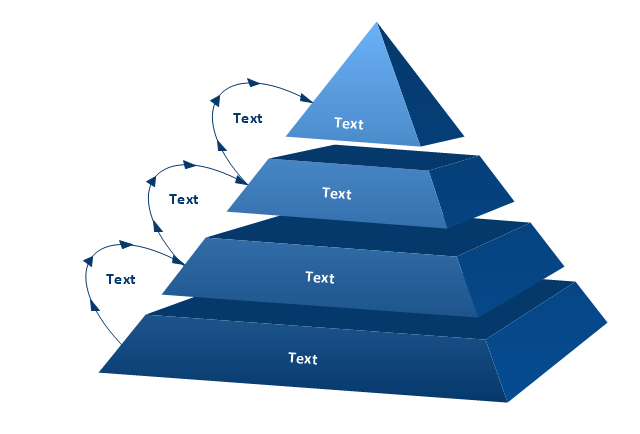
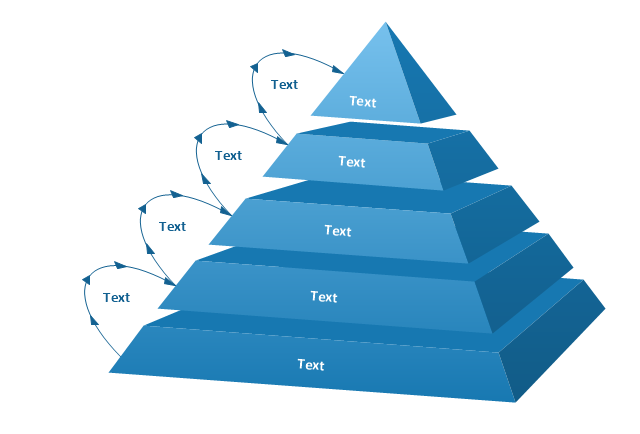
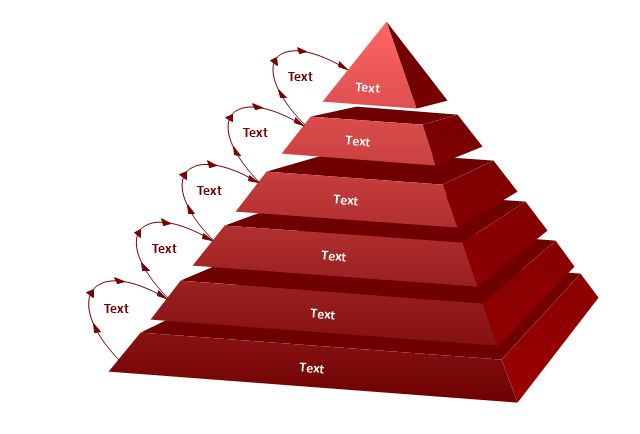
The vector stencils library "Pyramid diagrams" contains 28 templates of pyramid diagrams, triangle charts and triangular schemes.
Use these templates to create your pyramid diagrams in the ConceptDraw PRO diagramming and vector drawing software extended with the Pyramid Diagrams solution from the Marketing area of ConceptDraw Solution Park.
Use these templates to create your pyramid diagrams in the ConceptDraw PRO diagramming and vector drawing software extended with the Pyramid Diagrams solution from the Marketing area of ConceptDraw Solution Park.
Pyramid 1
Pyramid 2
Pyramid 3
Pyramid 4
Pyramid 5
Pyramid 1 Isometric
Pyramid 2 Isometric
Pyramid 3 Isometric
Pyramid 4 Isometric
Pyramid 5 Isometric
Triangle diagram, arrows
Triangle diagram
Triangular pyramid
Triangular diagram
Triangle scheme
Triangle chart

Triangle chart, isometric

Triangular scheme
Arrowed block pyramid

Funnel diagram
3-level funnel diagram
4-level funnel diagram
5-level funnel diagram
2-level pyramid diagram
3-level pyramid diagram
4-level pyramid diagram
5-level pyramid diagram
6-level pyramid diagram
 Directional Maps
Directional Maps solution extends ConceptDraw DIAGRAM software with templates, samples and libraries of vector stencils for drawing the directional, location, site, transit, road and route maps, plans and schemes.
 Pyramid Diagrams
Pyramid Diagrams solution extends ConceptDraw DIAGRAM software with templates, samples and library of vector stencils for drawing the marketing pyramid diagrams.
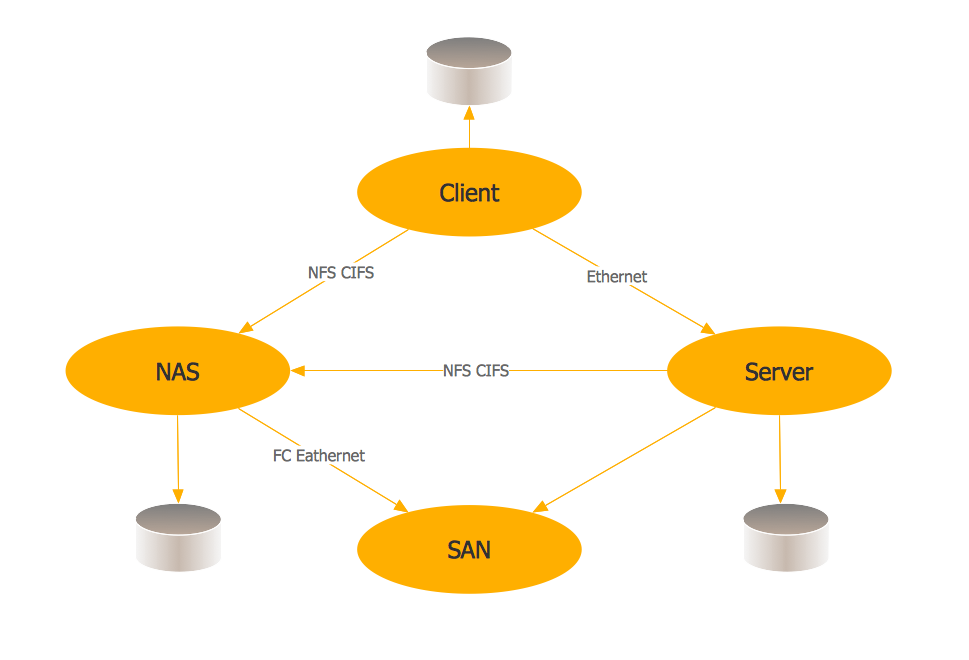
Storage area networks (SAN). Computer and Network Examples

HelpDesk
How to Draw a Histogram

 Telecommunication Network Diagrams
Telecommunication Network Diagrams solution extends ConceptDraw DIAGRAM software with samples, templates, and great collection of vector stencils to help the specialists in a field of networks and telecommunications, as well as other users to create Computer systems networking and Telecommunication network diagrams for various fields, to organize the work of call centers, to design the GPRS networks and GPS navigational systems, mobile, satellite and hybrid communication networks, to construct the mobile TV networks and wireless broadband networks.
 Maps
Maps
This solution extends ConceptDraw DIAGRAM.4 with the specific tools necessary to help you draw continental, directional, road, or transit maps, to represent international, business, or professional information visually.
Hybrid Network Topology

Star Network Topology


 Bar Graphs
The Bar Graphs solution enhances ConceptDraw DIAGRAM functionality with templates, numerous professional-looking samples, and a library of vector stencils for drawing different types of Bar Graphs, such as Simple Bar Graph, Double Bar Graph, Divided Bar Graph, Horizontal Bar Graph, Vertical Bar Graph, and Column Bar Chart.
 Audio, Video, Media
Use it to make professional-looking documents, impressive presentations, and efficient websites with colorful and vivid illustrations and schematics of digital audio, video and photo gadgets and devices, audio video connections and configurations, S Video connection, HD and 3D television systems, home entertainment systems, Closed-circuit television (CCTV) surveillance systems. All audio video schematics, drawings and illustrations designed in ConceptDraw DIAGRAM are professional looking, clear and understandable for all thanks to applying the most commonly used standards of designations, and are effective for demonstrating in front of a small audience and on the big screens.
Pyramid Diagram

- 3D Block diagram - Template
- 3D Block diagram - Template
- 3D Block diagram - Template | Block Diagrams | Basic Diagramming ...
- 3D Network Diagram Software | Pyramid Diagram | 3D Network ...
- Basic Diagramming | Business Flowchart Generation with ...
- 3D Block diagram template
- Directional Maps | How to Draw a Histogram | Block Diagram 3d ...
- Basic Diagramming | Block Diagrams | How to Draw a Histogram ...
- Basic Diagramming | Block Diagrams | Illustration Area | How To ...
- 3D Network Diagram Software | Basic Diagramming | Pyramid ...
- Block Diagrams
- Functional Block Diagram | Context Diagram Template | Functional ...
- Basic Diagramming | Functional Flow Block Diagram | Block ...
- Basic Diagramming
- Block Diagrams | How to Draw a Pyramid Diagram in ConceptDraw ...
- Block Diagrams | Directional Maps | Illustration Area | 3d Layered ...
- Basic Diagramming | Block Diagram Creator | Functional Block ...
- Basic Diagramming | Pyramid Diagram | Chart Examples | 3d ...
- The Building Blocks Used in EPC Diagrams | UML Block Diagram ...
- Drawing Bubble Diagrams In 3d