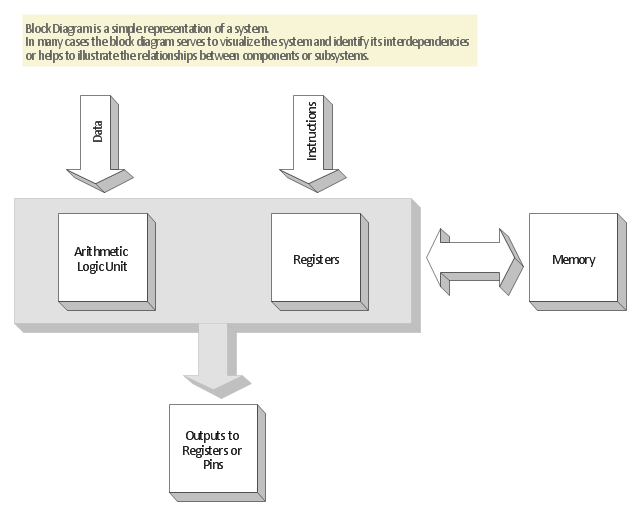
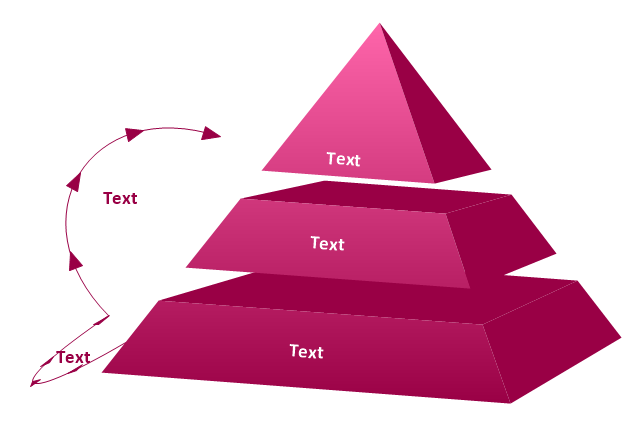
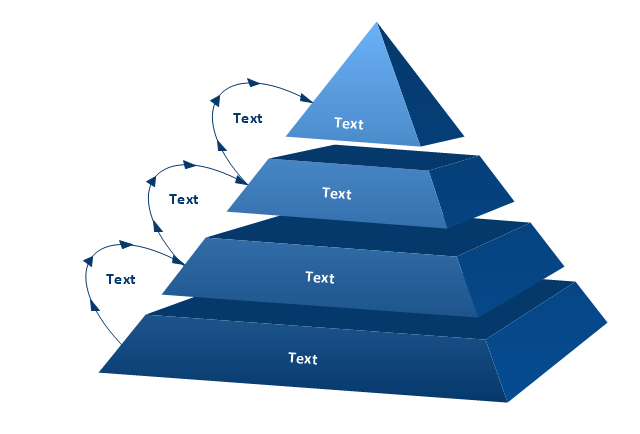
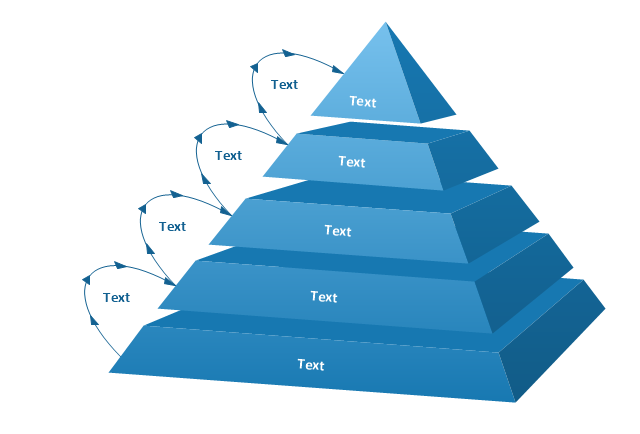
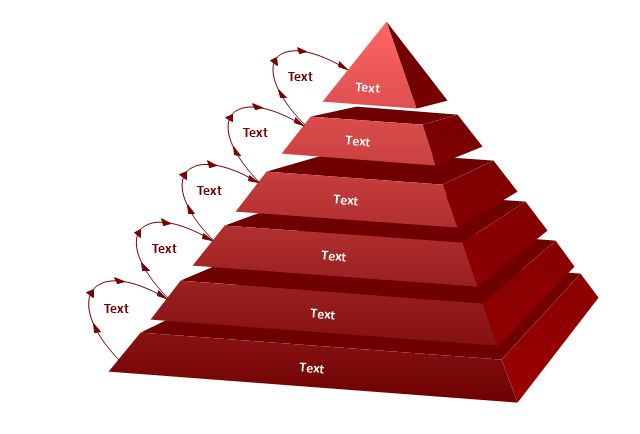
"The block diagram is typically used for a higher level, less detailed description aimed more at understanding the overall concepts and less at understanding the details of implementation. Contrast this with the schematic diagram and layout diagram used in the electrical engineering world, where the schematic diagram shows the details of each electrical component and the layout diagram shows the details of physical construction." [Block diagram. Wikipedia]
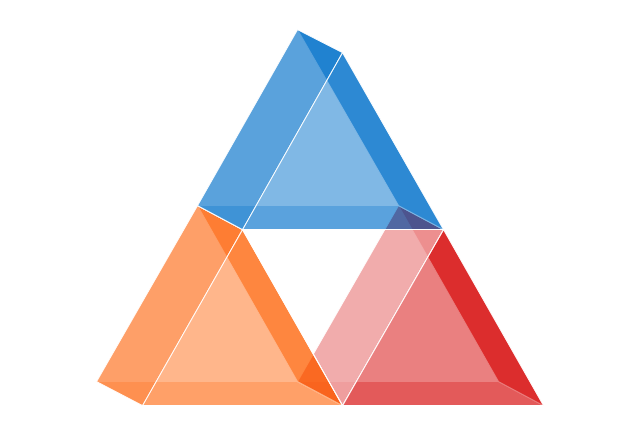
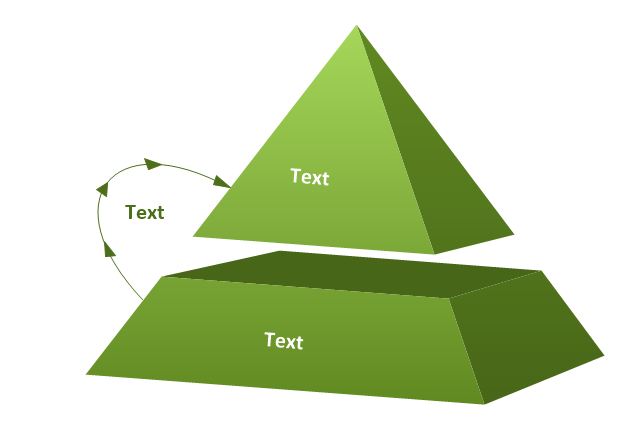
The 3D block diagram template for the ConceptDraw PRO diagramming and vector drawing software is included in the Block Diagrams solution from the area "What is a Diagram" of ConceptDraw Solution Park.
The 3D block diagram template for the ConceptDraw PRO diagramming and vector drawing software is included in the Block Diagrams solution from the area "What is a Diagram" of ConceptDraw Solution Park.
 Basic Diagramming
This solution extends ConceptDraw PRO software with the specific tools you need to easily draw flowcharts, block diagrams, histograms, pie charts, divided bar diagrams, line graphs, circular arrows diagrams, Venn diagrams, bubble diagrams and concept maps
 Block Diagrams
Block diagrams solution extends ConceptDraw PRO software with templates, samples and libraries of vector stencils for drawing the block diagrams.
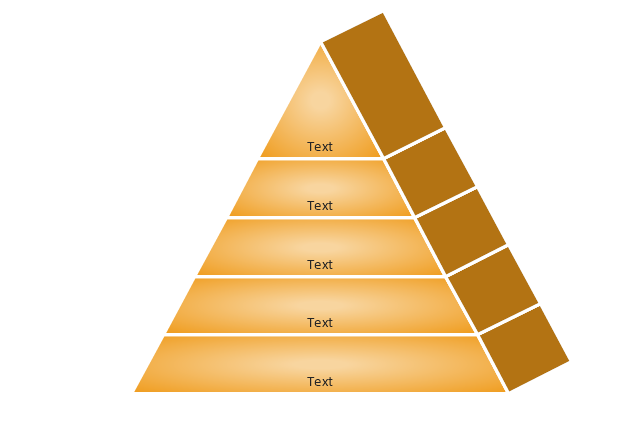
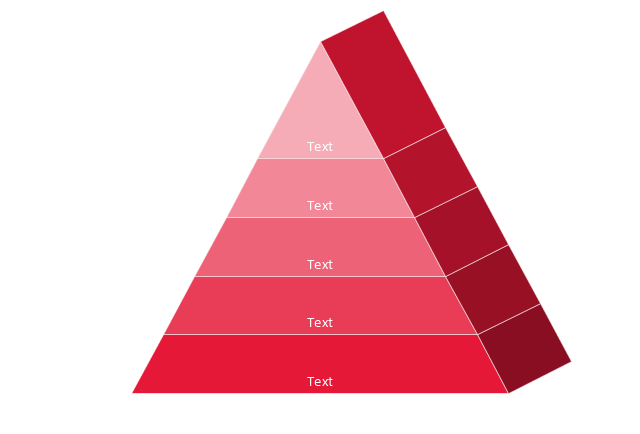
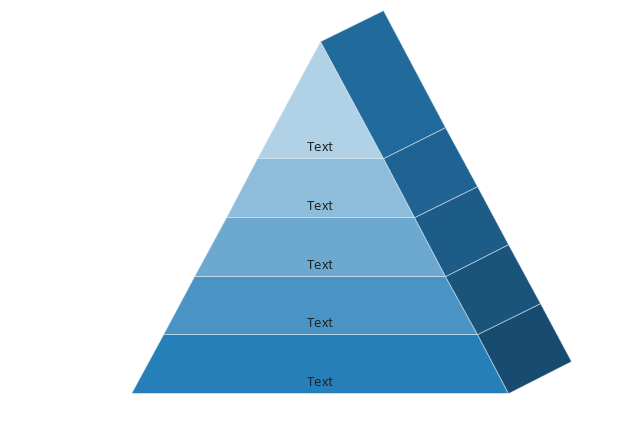
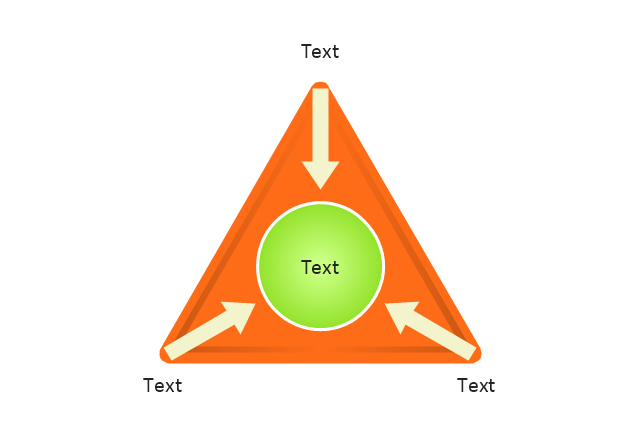
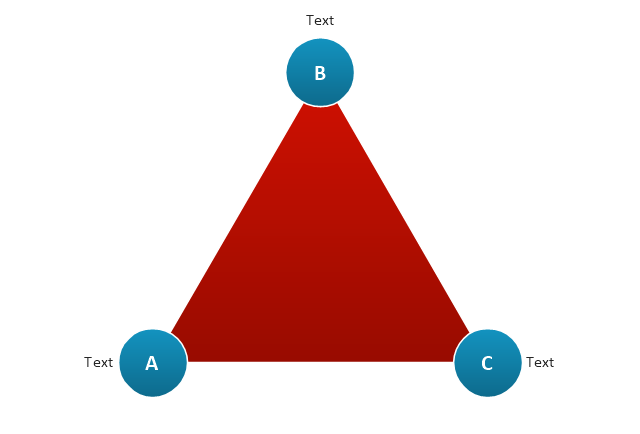
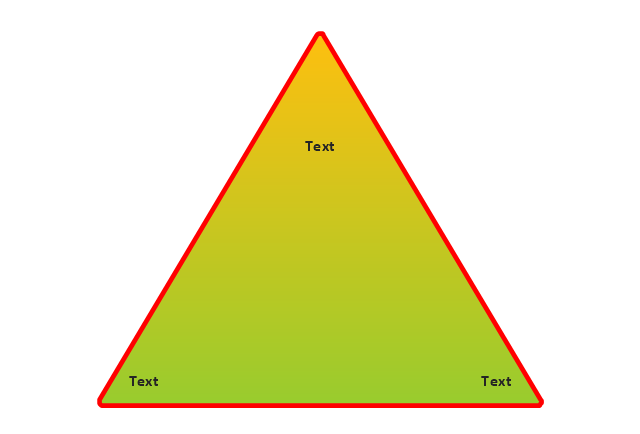
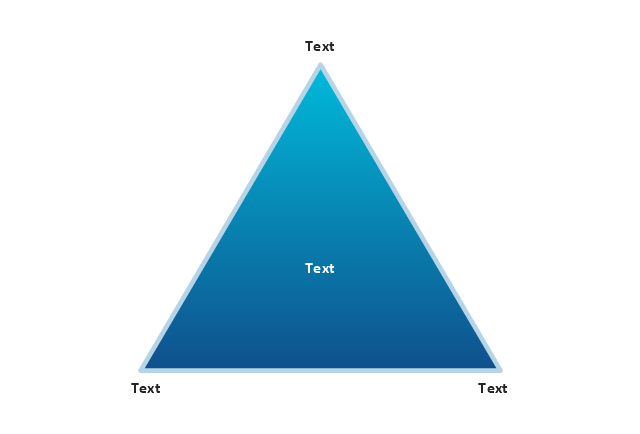
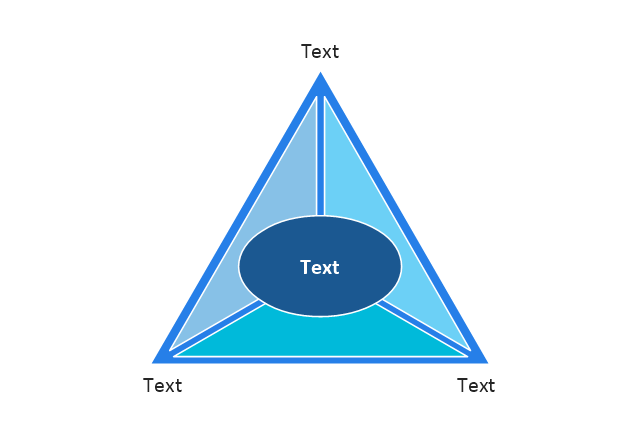
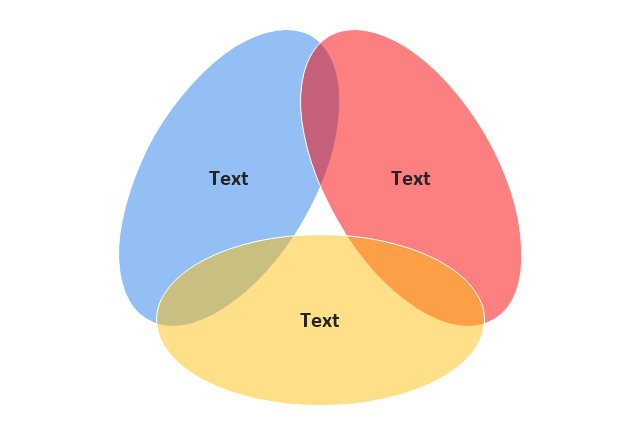
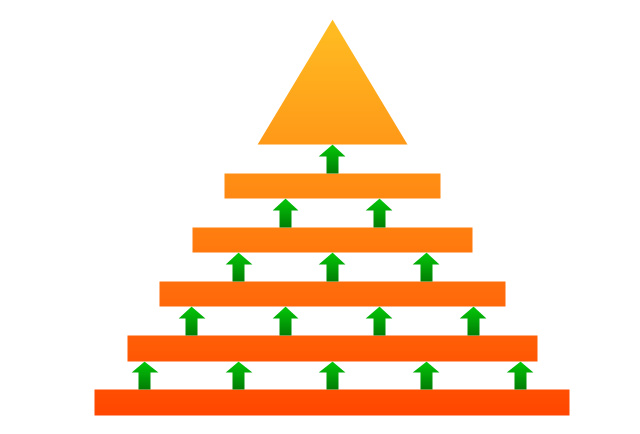
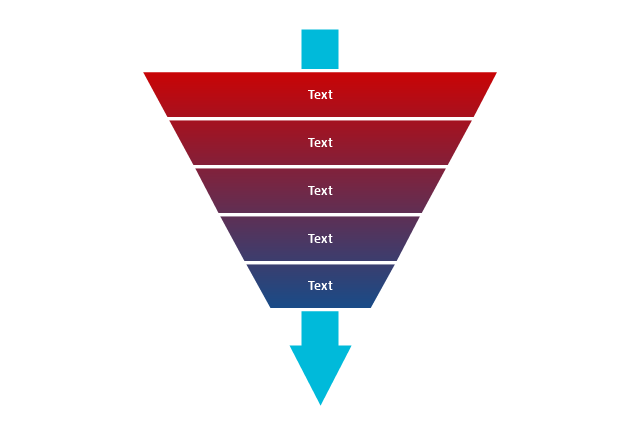
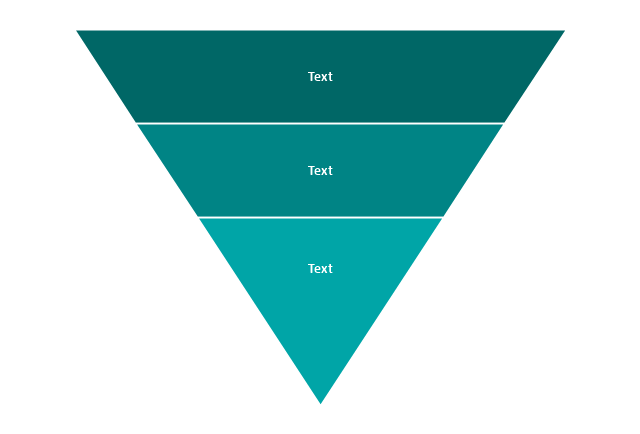
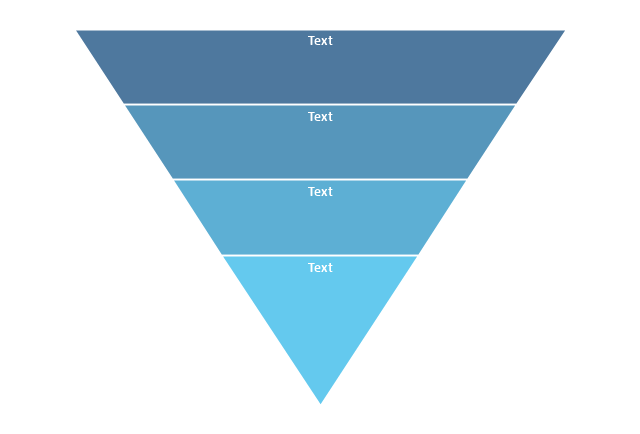
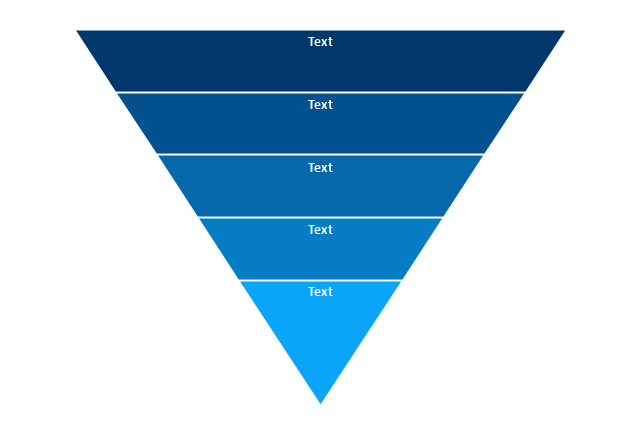
The vector stencils library "Pyramid diagrams" contains 28 templates of pyramid diagrams, triangle charts and triangular schemes.
Use these templates to create your pyramid diagrams in the ConceptDraw PRO diagramming and vector drawing software extended with the Pyramid Diagrams solution from the Marketing area of ConceptDraw Solution Park.
Use these templates to create your pyramid diagrams in the ConceptDraw PRO diagramming and vector drawing software extended with the Pyramid Diagrams solution from the Marketing area of ConceptDraw Solution Park.
HelpDesk
How to Draw a Histogram in ConceptDraw PRO
Histogram is a diagram used to visualize data through bars of variable heights. Making histogram can be helpful if you need to show data covering various periods (hours, days, weeks, etc). When the vertical column of the histogram refer to frequency it shows how many times any event happens. It is a Frequency histogram. A bar chart diagram is similar to a histogram, but in contrast to a bar chart a histogram represents the number how many times there have been certain data values. You can use a histogram to depict continual data flow such as temperature, time, etc. You can effortlessly draw histograms using the Histograms solution for CnceptDraw PRO. Making a histogram can by very useful to represent various statistical data.ConceptDraw Arrows10 Technology
You want to connecting objects manually? You don't know how should diagramming software work? Is it possible to develop a diagram as quickly as the ideas come to you? Yes. The innovative ConceptDraw Arrows10 Technology - This is more than enough versatility to draw any type of diagram with any degree of complexity. You can start draw your diagram manually now.- Functional Flow Block Diagram | 3D Block diagram - Template ...
- 3D Block diagram - Template
- 3D Block diagram - Template | Basic Diagramming | Block Diagrams ...
- 3D Network Diagram Software
- Basic Diagramming | Block Diagrams | Illustration Area | How To ...
- Block Diagram Of Computer In 3d
- Block Diagram Of 3d Oragnisation
- 3d Workflow Diagram
- Drawing Bubble Diagrams In 3d
