How Do Fishbone Diagrams Solve Manufacturing Problems

Fishbone Diagram Procedure

How to Construct a Fishbone Diagram

ConceptDraw Arrows10 Technology

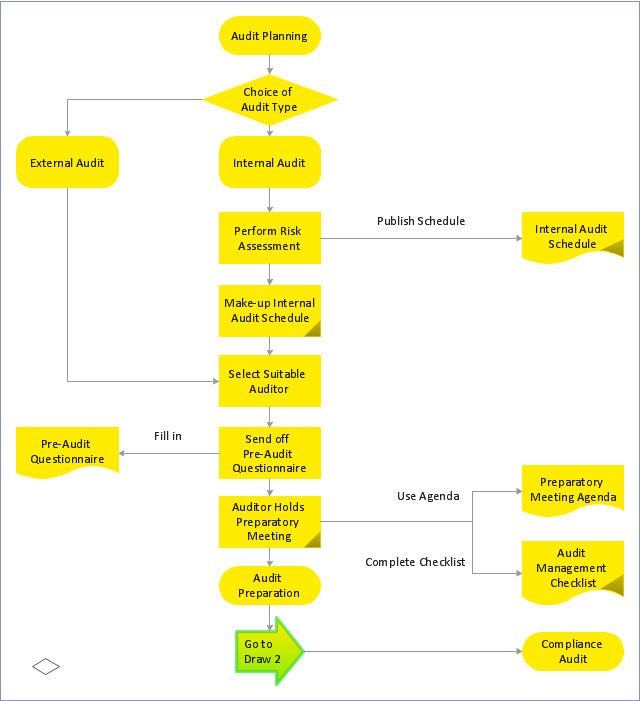
"Audit planning is a vital area of the audit primarily conducted at the beginning of audit process to ensure that appropriate attention is devoted to important areas, potential problems are promptly identified, work is completed expeditiously and work is properly coordinated. "Audit planning" means developing a general strategy and a detailed approach for the expected nature, timing and extent of the audit. The auditor plans to perform the audit in an efficient and timely manner. ...
An Audit plan is the specific guideline to be followed when conducting an audit. It helps the auditor obtain sufficient appropriate evidence for the circumstances, helps keep audit costs at a reasonable level, and helps avoid misunderstandings with the client.
It addresses the specifics of what, where, who, when and how:
What are the audit objectives?
Where will the audit be done? (i.e. scope)
When will the audit(s) occur? (how long?)
Who are the auditors?
How will the audit be done?" [Audit plan. Wikipedia]
The audit planning flowchart example was created using the ConceptDraw PRO diagramming and vector drawing software extended with the Audit Flowcharts solution from the Finance and Accounting area of ConceptDraw Solution Park.
www.conceptdraw.com/ solution-park/ finance-audit-flowcharts
Flowchart 1
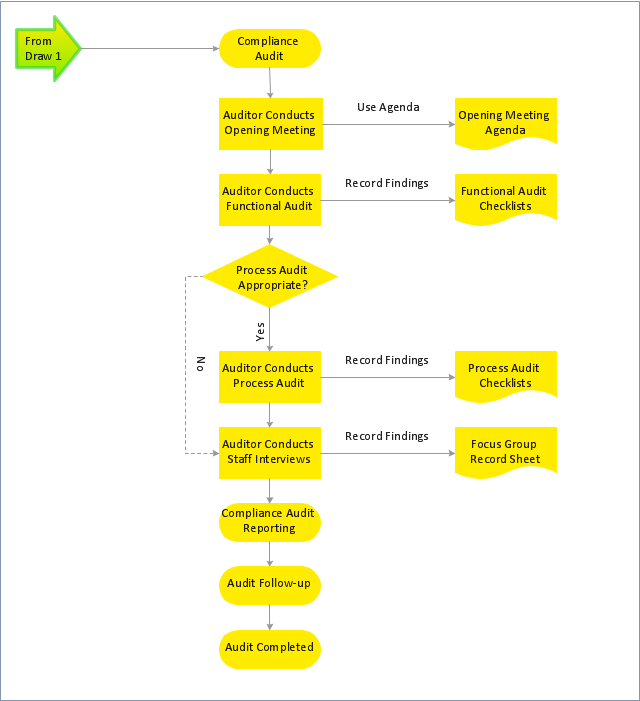
Flowchart 2
 Nature
This solution extends ConceptDraw PRO software with samples, templates and libraries of vector clipart for drawing the Nature illustrations. Use it to make professional-looking documents, presentations and websites illustrated with color scalable vector c
Basic Flowchart Symbols and Meaning


Process Flowchart


Geo Map - South America - Trinidad and Tobago

Expand collaboration capabilities with ConceptDraw PRO

Bubble diagrams in Landscape Design with ConceptDraw PRO

IDEF9 Standard

Geo Map - Europe - United Kingdom

Geo Map - Asia - Sri Lanka

Geo Map - Asia - Singapore

- Drawing Illustration | Drawing a Nature Scene | Water Cycle |
- Drawing a Nature Scene | Drawing Illustration | Water Cycle |
- Drawing a Nature Scene | Drawing Illustration | Nature |
- Process Flowchart
- Design elements - Accounting flowcharts | Basic Flowchart Symbols ...
- Logical network topology diagram | Cisco logical network diagram ...
- Design elements - Fire and emergency planning |
- How to Draw a Computer Network Diagrams | Cisco Network ...
- Engineering | Universal Diagramming Area | Design elements ...
- Cisco LAN fault-tolerance system - diagram | How to Draw a ...
- Audit process flowchart (multipage) | Audit Flowcharts | Audit ...
- Design elements - Accounting flowcharts | Winter Sports | Workflow ...
- Audit flowchart - Project management process | Audit Flowcharts ...
- How To Draw Building Plans | How To use House Plan Software ...
- Flowchart - Product life cycle process | Draw Flowcharts with ...
- Audit flowchart - Project management process | Audit flowchart (two ...
- Network Diagramming Software for Design Cisco Network Diagrams ...
- Process flow diagram template | Process Flowchart | Flow Diagram ...
- Design elements - Parking and roads | Building Drawing Software ...
- Audit Flowcharts | Audit flowchart - Project management process ...