Chart Examples

HelpDesk
How to Draw a Histogram

 Histograms
How to make a Histogram? Making a Histogram is an incredibly easy process when it is done with ConceptDraw DIAGRAM. The Histograms Solution enhances ConceptDraw DIAGRAM functionality with extensive drawing tools, numerous samples, and examples; also a quick-start template and library of ready vector stencils for visualization the data and professional drawing Histograms.
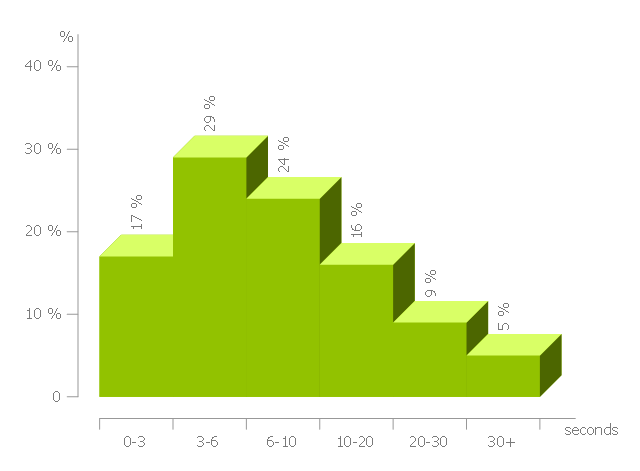
This histogram sample shows the frequency distribution of web page load time.
"Web performance optimization, WPO, or website optimization is the field of knowledge about increasing the speed in which web pages are downloaded and displayed on the user's web browser. ...
With the average internet speed now increasing globally, it's fitting for website administrators and "webmasters" to consider the time it takes for websites to render for the visitor.
Faster website download speeds have been shown to increase visitor retention and loyalty and user satisfaction, especially for users with slow internet connections and those on mobile devices. Web performance also leads to less data travelling across the web, which in turn lowers a website's power consumption and environmental impact. Some aspects which can affect the speed of page load include Browser/ Server Cache, Image Optimization and also encryption (for example SSL), which can affect the time it takes for pages to render." [Web performance optimization. Wikipedia]
The histogram example "Page load time" was created using the ConceptDraw PRO diagramming and vector drawing software extended with the Histograms solution from the Graphs and Charts area of ConceptDraw Solution Park.
Histogram
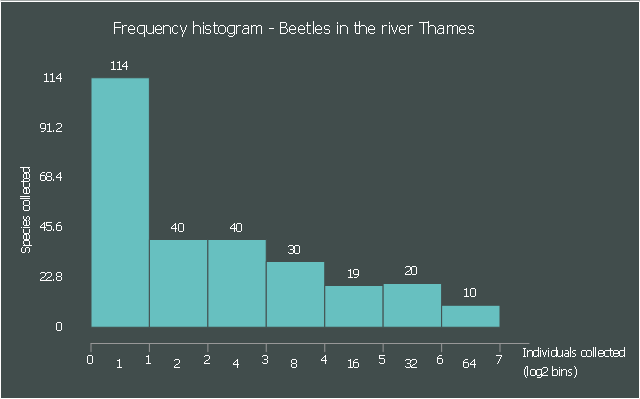
This frequency histogram sample shows the relative species abundance of beetles sampled from the river Thames. It was designed on the base of the Wikimedia Commons file: PrestonPlot beetles.png.
[commons.wikimedia.org/ wiki/ File:PrestonPlot_ beetles.png]
"Relative species abundance is a component of biodiversity and refers to how common or rare a species is relative to other species in a defined location or community. Relative species abundances tend to conform to specific patterns that are among the best-known and most-studied patterns in macroecology. ...
Relative species abundance distributions are usually graphed as frequency histograms (“Preston Plots”) or rank-abundance diagrams ("Whittaker Plots”)." [Relative species abundance. Wikipedia]
The frequency histogram example "Beetles in the river Thames" was created using the ConceptDraw PRO diagramming and vector drawing software extended with the Histograms solution from the Graphs and Charts area of ConceptDraw Solution Park.
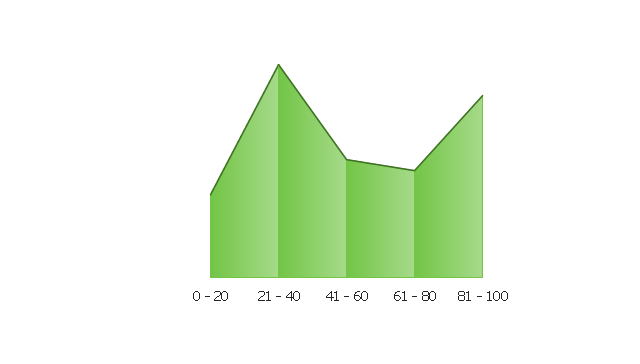
Frequency histogram
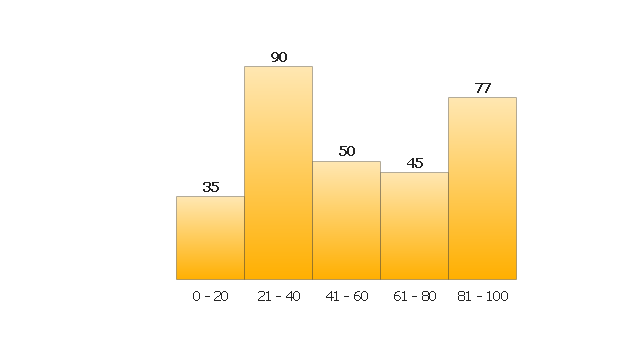
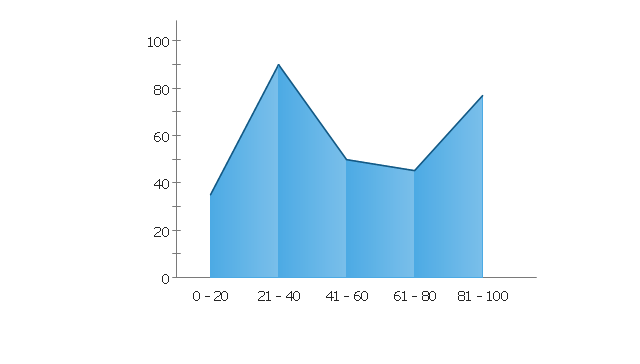
The vector stencils library "Frequency distribution charts" contains 2 area chart templates and 2 histogram templates.
Frequency distribution charts are Live Objects which show the distribution of items within numerical ranges.
Use this library for drawing visual dashboards in the ConceptDraw PRO diagramming and vector drawing software extended with the Frequency Distribution Dashboard solution from the area "What is a Dashboard" of ConceptDraw Solution Park.
Histogram 1

Histogram 2
Area Chart 1
Area Chart 2
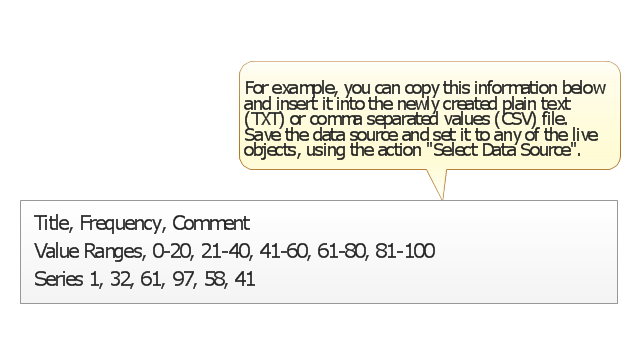
Data Source File Example
 Frequency Distribution Dashboard
Frequency distribution dashboard solution extends ConceptDraw DIAGRAM software with samples, templates and vector stencils libraries with histograms and area charts for drawing the visual dashboards showing frequency distribution of data.
 ConceptDraw Solution Park
ConceptDraw Solution Park collects graphic extensions, examples and learning materials
Examples of Flowcharts, Org Charts and More


 Dashboards Area
Solutions from the area Dashboards of ConceptDraw Solution Park collects templates, samples and vector stencils libraries with of data driven charts and indicators for drawing the basic types of Visual Dashboards.
 Computer and Networks Area
The solutions from Computer and Networks Area of ConceptDraw Solution Park collect samples, templates and vector stencils libraries for drawing computer and network diagrams, schemes and technical drawings.
 Event-driven Process Chain Diagrams
Event-Driven Process Chain Diagrams solution extends ConceptDraw DIAGRAM functionality with event driven process chain templates, samples of EPC engineering and modeling the business processes, and a vector shape library for drawing the EPC diagrams and EPC flowcharts of any complexity. It is one of EPC IT solutions that assist the marketing experts, business specialists, engineers, educators and researchers in resources planning and improving the business processes using the EPC flowchart or EPC diagram. Use the EPC solutions tools to construct the chain of events and functions, to illustrate the structure of a business process control flow, to describe people and tasks for execution the business processes, to identify the inefficient businesses processes and measures required to make them efficient.
 Mind Map Exchange
This solution extends ConceptDraw MINDMAP software with the ability to easily exchange mind maps with a large variety of other mind mapping applications.
 Fault Tree Analysis Diagrams
This solution extends ConceptDraw DIAGRAM.5 or later with templates, fault tree analysis example, samples and a library of vector design elements for drawing FTA diagrams (or negative analytical trees), cause and effect diagrams and fault tree diagrams.
 Seating Plans
The Seating Plans solution including samples, seating chart templates and libraries of vector design elements assists in creating the Seating plans, Seating arrangement charts, Chair layout designs, Plan drawings of cinema seating, Movie theater chair plans, extensive Cinema theater plans depicting the seating arrangement in the cinema halls, location of closet, cafe and food sale area, in designing the Seating plans for the large seating areas, Seat plan designs for airplanes, trains, etc. Use any of the included samples as the table seating chart template or seating chart template free and achieve professional drawing results in a few minutes.
 Value Stream Mapping
Value stream mapping solution extends ConceptDraw DIAGRAM software with templates, samples and vector stencils for drawing the Value Stream Maps (VSM) in lean manufacturing practice.
 Computer Network Diagrams
Computer Network Diagrams solution extends ConceptDraw DIAGRAM software with samples, templates and libraries of vector icons and objects of computer network devices and network components to help you create professional-looking Computer Network Diagrams, to plan simple home networks and complex computer network configurations for large buildings, to represent their schemes in a comprehensible graphical view, to document computer networks configurations, to depict the interactions between network's components, the used protocols and topologies, to represent physical and logical network structures, to compare visually different topologies and to depict their combinations, to represent in details the network structure with help of schemes, to study and analyze the network configurations, to communicate effectively to engineers, stakeholders and end-users, to track network working and troubleshoot, if necessary.
 Spatial Infographics
Spatial infographics solution extends ConceptDraw DIAGRAM software with infographic samples, map templates and vector stencils libraries with design elements for drawing spatial information graphics.
 Reflected Ceiling Plans
Reflected Ceiling Plans solution extends greatly the ConceptDraw DIAGRAM functionality with samples, templates and libraries of design elements for displaying the ceiling ideas for living room, bedroom, classroom, office, shop, restaurant, and many other premises. It is an effective tool for architects, designers, builders, electricians, and other building-related people to represent their ceiling design ideas and create Reflected Ceiling plan or Reflective Ceiling plan, showing the location of light fixtures, lighting panels, drywall or t-bar ceiling patterns, HVAC grilles or diffusers that may be suspended from the ceiling. Being professional-looking and vivid, these plans perfectly reflect your ceiling ideas and can be presented to the client, in reports, in presentations, on discussions with colleagues, or successfully published in modern print or web editions.
 Business Process Diagrams
Business Process Diagrams solution extends the ConceptDraw DIAGRAM BPM software with RapidDraw interface, templates, samples and numerous libraries based on the BPMN 1.2 and BPMN 2.0 standards, which give you the possibility to visualize equally easy simple and complex processes, to design business models, to quickly develop and document in details any business processes on the stages of project’s planning and implementation.
- How to Draw a Histogram in ConceptDraw PRO | Chart Examples ...
- Histograms | Frequency Distribution Dashboard | Pyramid Chart ...
- Histograms | Chart Examples | Bar Chart Examples | Histogram Visio
- How to Draw a Histogram in ConceptDraw PRO | Chart Examples ...
- Chart Examples | Projects HR dashboard | Column Chart Examples ...
- Histogram template | Frequency histogram - Page load time | Chart ...
- Frequency histogram - Beetles in the river Thames | Geography ...
- Histograms | Visual Presentations Made Easy with Diagramming ...
- Histograms | Chart Examples | Frequency histogram - Beetles in the ...
- Histograms - Vector stencils library | Graphs and Charts Area ...
- Chart Examples | Basic Diagramming | Best Software to Draw ...
- Design elements - Histograms | Histogram template | Design ...
- Chart Examples
- Histograms | Design elements - Histograms | Histogram template ...
- Frequency histogram - Page load time | Web Performance ...
- The Best Drawing Program for Mac | Best Software to Draw ...
- Frequency histogram - Page load time | Frequency histogram ...
- Chart Examples | Garrett IA Diagrams with ConceptDraw PRO ...
- How to Draw an Organization Chart | Pie Chart Examples and ...
- Chart Examples | Pie Chart Examples | Line Chart Examples ...