How to Create a Cross Functional Flow Chart

What is a Cross Functional Flow Chart?

Social Media Response Management DFD Charts - software tools


 Cross-Functional Flowcharts
Cross-functional flowcharts are powerful and useful tool for visualizing and analyzing complex business processes which requires involvement of multiple people, teams or even departments. They let clearly represent a sequence of the process steps, the order of operations, relationships between processes and responsible functional units (such as departments or positions).
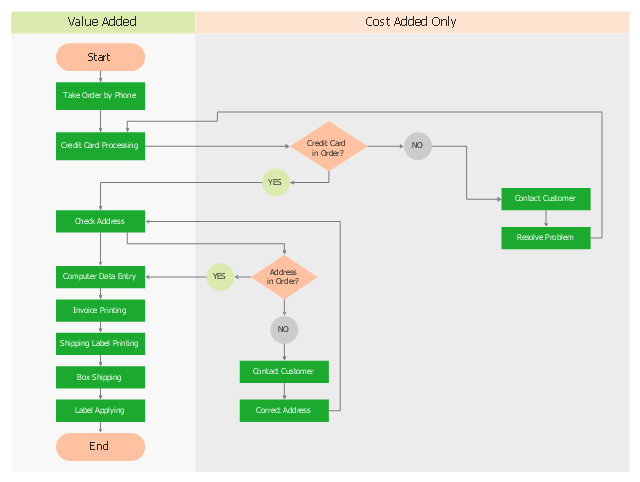
"Opportunity flowcharts are a variation of detailed basic flowcharts. They get their name because they highlight opportunities for improvement. Like all flowcharts, they make the process visible. But they take this idea one step further by separating value-added steps (those essential for making the product or service) from cost-added-only steps (those that are included only to check for or fix problems). ...
An opportunity flowchart is created by rearranging a detailed basic flowchart. The steps needed if everything works perfectly should flow down the left side of the chart. Steps that exist because of problems and inefficiencies flow across the right side." [Flowcharts: Plain & Simple. Inc Staff Joiner Assocs. 1995. P. 60.]
The opportunity flow chart example "Order processing" was created using the ConceptDraw PRO diagramming and vector drawing software extended with the Cross-Functional Flowcharts solution from the Business Processes area of ConceptDraw Solution Park.
Opportunity flowchart
Double-headed Cross Functional Flowchart

Basic Flowchart Symbols and Meaning


Contoh Flowchart

Example of Organizational Chart


Swim Lane Diagrams

Cross-Functional Flowchart


ConceptDraw PRO - Organizational chart software

Cross Functional Flowchart for Business Process Mapping

Business Process Reengineering Examples

 Business Processes
Business Process solution extends ConceptDraw PRO software with business process diagrams as cross-functional flowcharts, workflows, process charts, IDEF0, timelines, calendars, Gantt charts, business process modeling, audit and opportunity flowcharts.
- Replacing engine oil - Opportunity flowchart | Opportunity flowchart ...
- Work Order Process Flowchart . Business Process Mapping Examples
- Order processing - EPC flow chart | Order processing - Cross ...
- How to Create a Cross Functional Flow Chart | Basic Flowchart ...
- Work Order Process Flowchart . Business Process Mapping ...
- Replacing engine oil - Opportunity flowchart | Basic Flowchart ...
- Lead to opportunity sales flow | Replacing engine oil - Opportunity ...
- Replacing engine oil - Opportunity flowchart | Cross Functional ...
- Business Process Modeling Notation | Top 5 Android Flow Chart ...
- Process Flowchart | Replacing engine oil - Opportunity flowchart ...
- Functional Organizational Structure | How to Create a Cross ...
- Basic Flowchart Examples | Replacing engine oil - Opportunity ...
- Work Order Process Flowchart . Business Process Mapping Examples
- Cross Functional Flowchart for Business Process Mapping
- How to Create a Cross Functional Flow Chart | Types of Flowchart ...
- Replacing engine oil - Opportunity flowchart | Cross-Functional ...
- Order processing - Cross-functional flowchart | Cross-Functional ...
- Process Flowchart | Types of Flowcharts | Business process Flow ...
- Cross-Functional Flowcharts | Create Workflow Diagram | Optimize a ...
- Work Order Process Flowchart . Business Process Mapping ...