How to Create a Powerful Infographic When You do not Have a Designer
Create a powerful infographic, become inspired by the people with ConceptDraw.HelpDesk
How to Create Infographics Using the Spatial Infographics Solution
Tips on how to use ConceptDraw Spatial Infographics Solution. Now you got the tool for quick and easy drawing and presenting of your own simple Spatial Infographics documents.How to Create an Infographic
How to Create an Infographic? It’s very easy! All what you need is a powerful infographic software. Never before creation of Infographics wasn’t so easy as now with Typography Infographics Solution from the “What are Infographics” Area for ConceptDraw Solution Park.
 Spatial Infographics
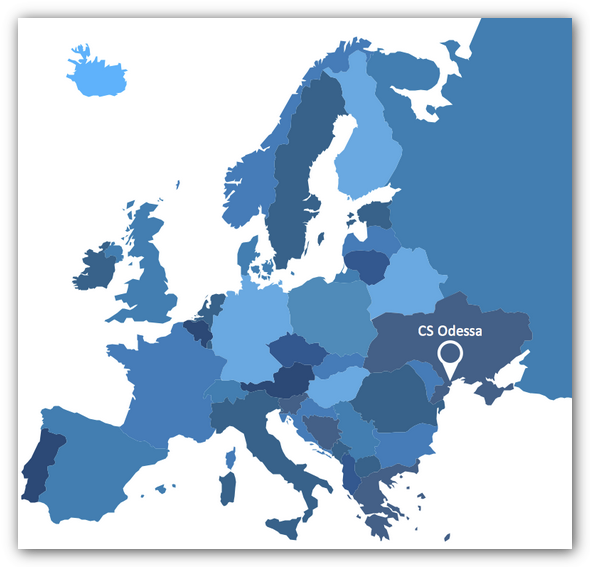
Spatial infographics solution extends ConceptDraw PRO software with infographic samples, map templates and vector stencils libraries with design elements for drawing spatial information graphics.
HelpDesk
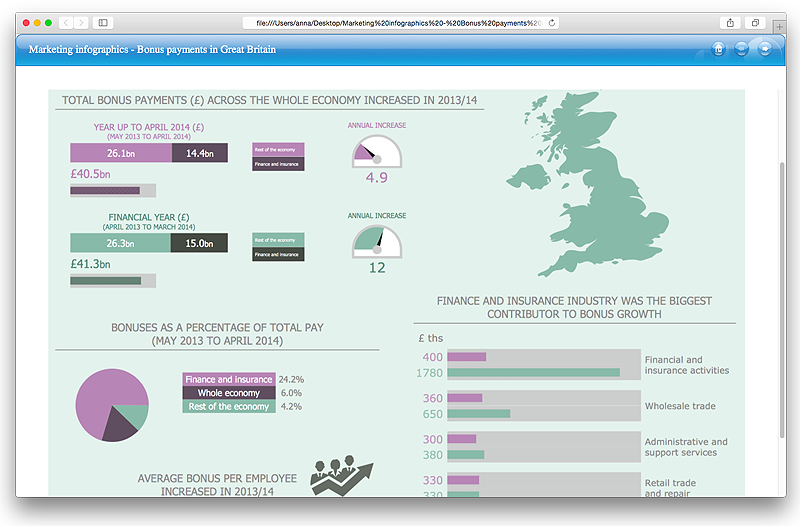
How to Use ConceptDraw Infographic in Presentations, Documents, and Publications
Exporting, embedding, and pasting as a picture are the ways you can use to add ConceptDraw drawings to presentations, documents, and publications.HelpDesk
How to Make a Web Page from Infographics in ConceptDraw PRO
Create your own original marketing illustrations and infographics, presentation slides, website, and blog pages using ConceptDraw PRO.
 ConceptDraw Solution Park
ConceptDraw Solution Park collects graphic extensions, examples and learning materials
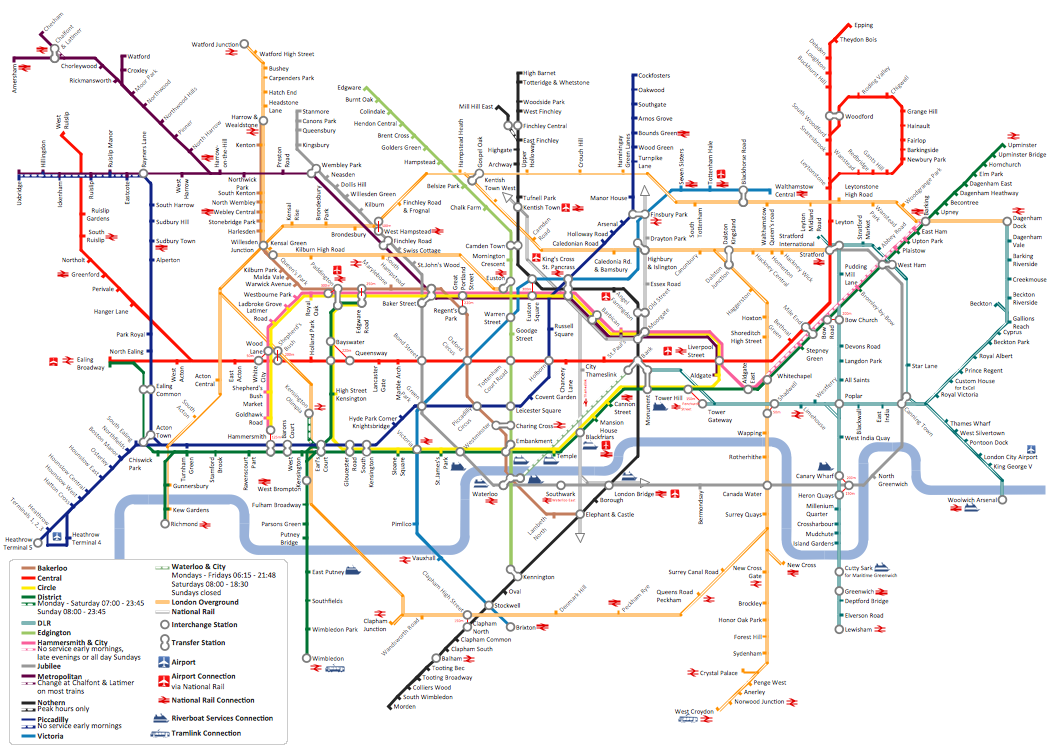
How to draw Metro Map style infographics? (London)
Tool to draw Metro Map styled inforgraphics. London Tube map sample.Tools to Create Your Own Infographics
Over the past few centuries, data visualization has evolved so much that we use it every day in all areas of our lives. Many believe that infographic is an effective tool of storytelling, as well as analytics, and that it is able to overcome most of the language and educational barriers. Understanding the mechanisms of human perception will help you to understand how abstract forms and colors used in data visualization can transmit information more efficient than long paragraphs of text.
 What are Infographic Area
Solutions of the area What is Infographics from ConceptDraw Solution Park collect templates, samples and vector stencils libraries with design elements for the drawing information graphics.
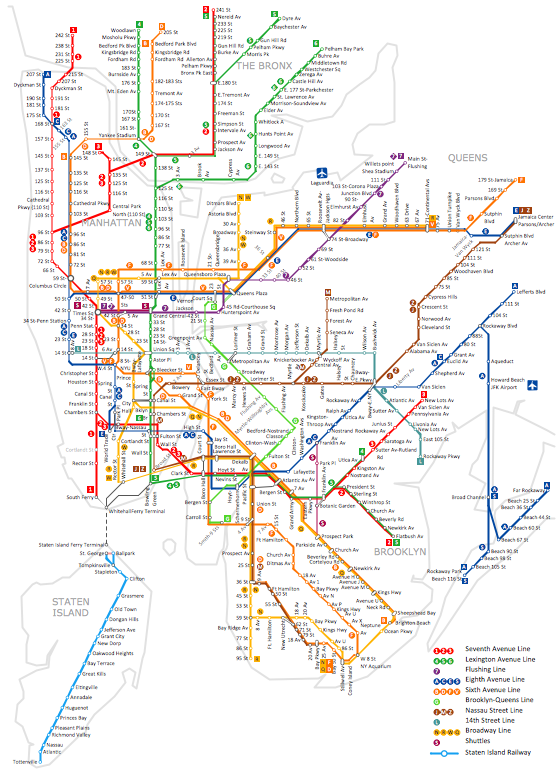
Infographic software: the sample of New York City Subway map
Tool to draw Metro Map styled inforgraphics. New York City Subway map sample.Typography Font
How to create an infographic and make it successful and professional looking? It is a complex process with great quantity of important moments that you should consider. Design and Typography Font play the significant role in the success of typography graphic.Typography Font makes your Typography Infographic unique and attractive. ConceptDraw PRO extended with Typography Infographics Solution from the “What are Infographics” Area provides you the useful tools for simple and quick designing various Typography Infographics.
Subway infographic design elements - software tools
Subway infographic design elements of MetroMap and ConceptDraw software tools.Typography Art
Typography Infographics Solution for ConceptDraw Solution Park is the best answer on the question “How to create an Infographic?”. The Typography Infographics created in ConceptDraw PRO using the Typography Infographics Solution are the real typography art.Typography Infographic Examples
ConceptDraw PRO extended with Typography Infographics Solution from the “What are Infographics” Area is a powerful infographic software that offers you variety of infographics examples.Use of predesigned examples as the base for your own Typography Infographics is a timesaving and useful way. Simply open the desired example, change for your needs and then successfully use it in any field of your activity.
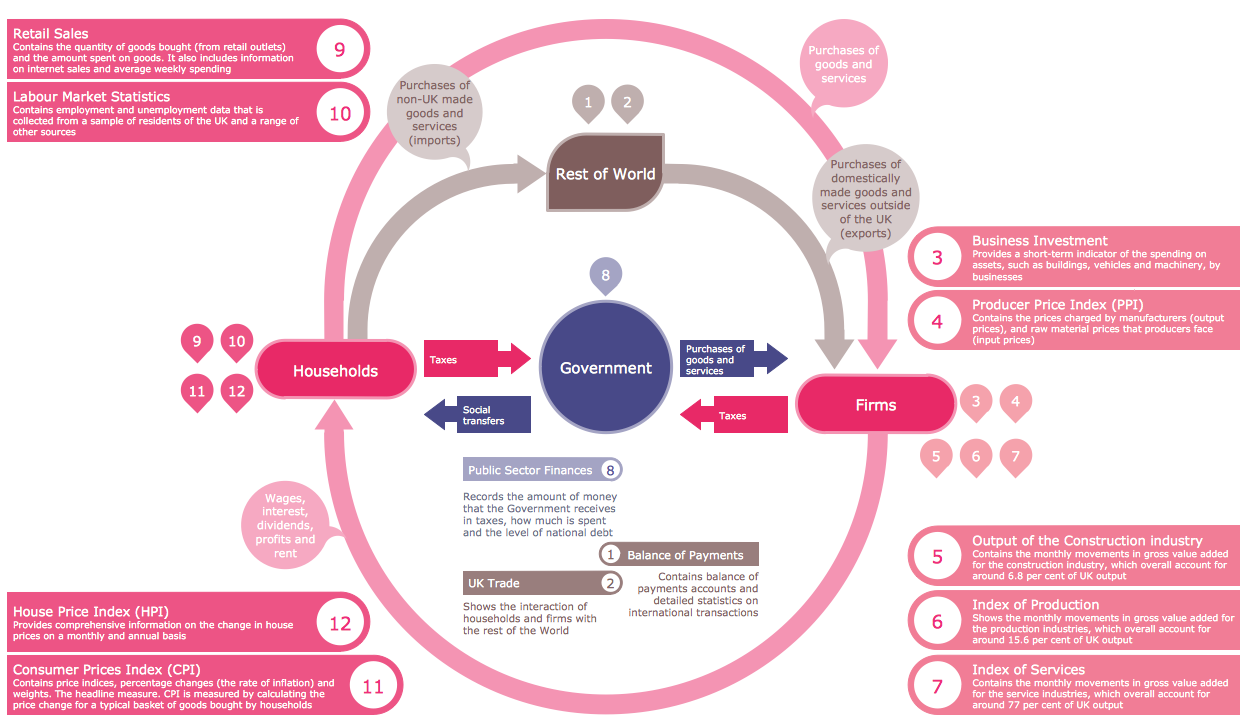
Design Pictorial Infographics. Design Infographics
In the course of recent decades data visualization went through significant development and has become an indispensable tool of journalism, business intelligence and science. The way visual information may be conveyed is not limited simply to static or dynamic representation, it can also be interactive. Infographics can be conditionally divided into several general levels. Primarily, this is level of visualization of information, its interpretation and association on any ground. Second level can be defined as a visualization of knowledge, depiction of thoughts and ideas in the form of images or diagrams. Finally, the level of data visualization, which processes data arrays in charts, enabling the information to be more clearly perceived. You can also identify the main approaches to the creation of infographics: exploratory and narrative. Exploratory method insists on minimalist design in favor of data precision without unnecessary details and is common for scientific researches and ana- How to draw Metro Map style infographics ? (New York) | How to ...
- How to Create a Powerful Infographic When You do not Have a ...
- How to Create a Powerful Infographic When You do not Have a ...
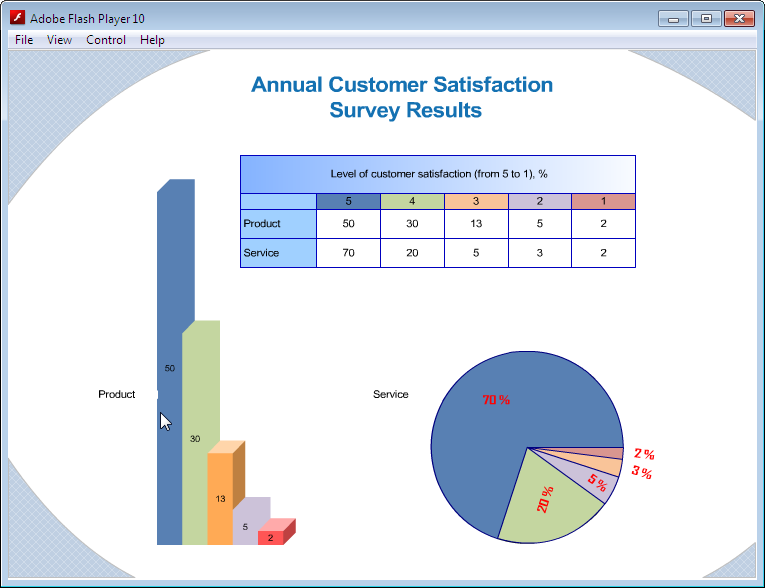
- Best Tool for Infographic Construction | How to Create a Powerful ...
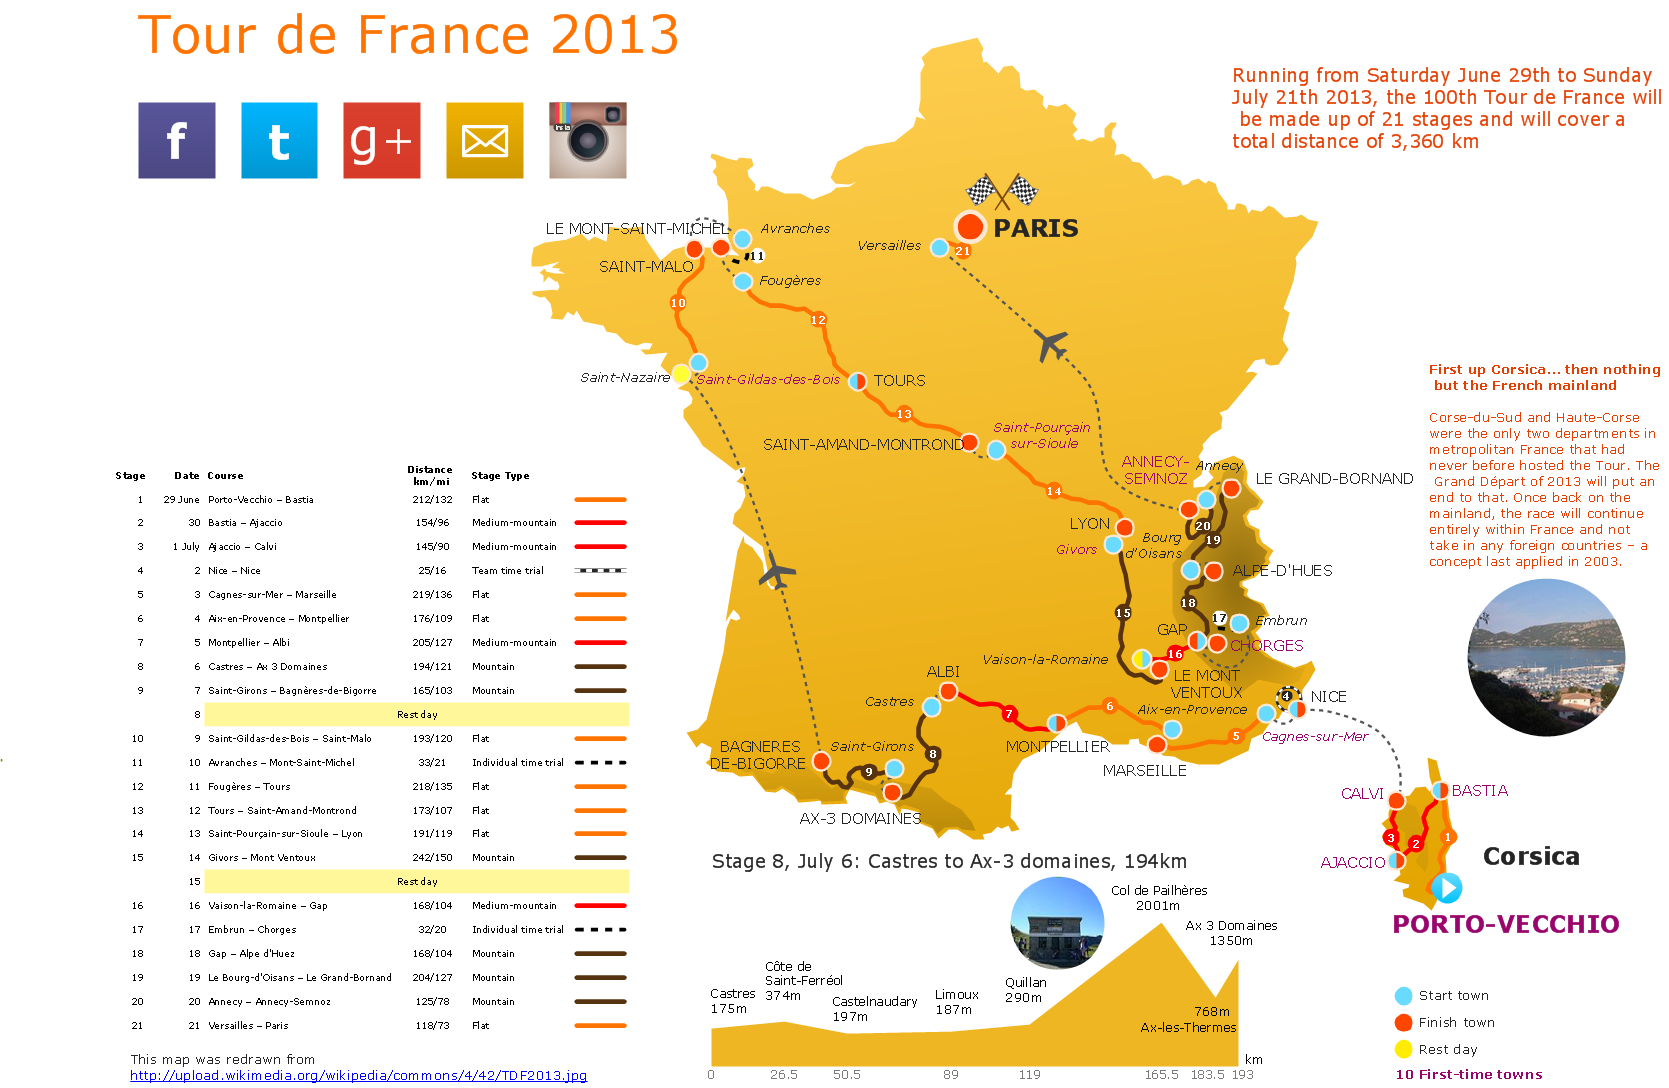
- The 100th Tour de France - Route map | How to Create a Powerful ...
- How to Create a Powerful Infographic When You do not Have a ...
- Entity-Relationship Diagram (ERD) | How to Create a Powerful ...
- The 100th Tour de France | How to Create a Powerful Infographic ...
- Spatial Infographics | How to Create Infographics Using the Spatial ...
- How To Create Emergency Plans | Map Infographic Maker | How To ...
- How to draw Metro Map style infographics ? (New York)
- How to draw Metro Map style infographics ? Moscow, New York, Los ...
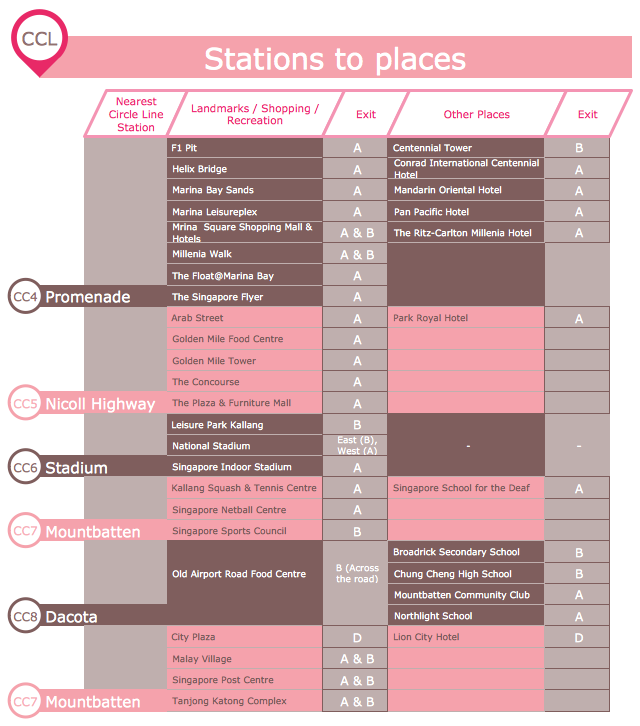
- Transportation Infographics | How to Create a Powerful Infographic ...
- Tools to Create Your Own Infographics | Best Flowchart Software ...
- Spatial infographics Design Elements: Location Map | Map ...
- What is Infographics Area | How to draw Metro Map style ...
- How to draw Metro Map style infographics ? (London) | Infographic ...
- Tools to Create Your Own Infographics | Spatial infographics Design ...
- Map Infographic Creator | Spatial infographics Design Elements ...
- Spatial Infographics
