Made with
ConceptDraw
DIAGRAM 18

Typography Infographic Examples

ConceptDraw DIAGRAM extended with Typography Infographics Solution from the “Infographics” Area is a powerful infographic software that offers you variety of infographics examples.

CCL Stations to PlacesTypography Art - CCL Stations to Places Egypt Timeline of Communication ShutdownEgypt Timeline of Communication Shutdown Hierarchy of LawsTypography Art - Hierarchy of Laws

All infographics examples from the Typography Infographics Solution were designed in ConceptDraw DIAGRAM to help you in your own typography infographics designing. They are available from ConceptDraw STORE.

Typography Infographics Solution in ConceptDraw STORE

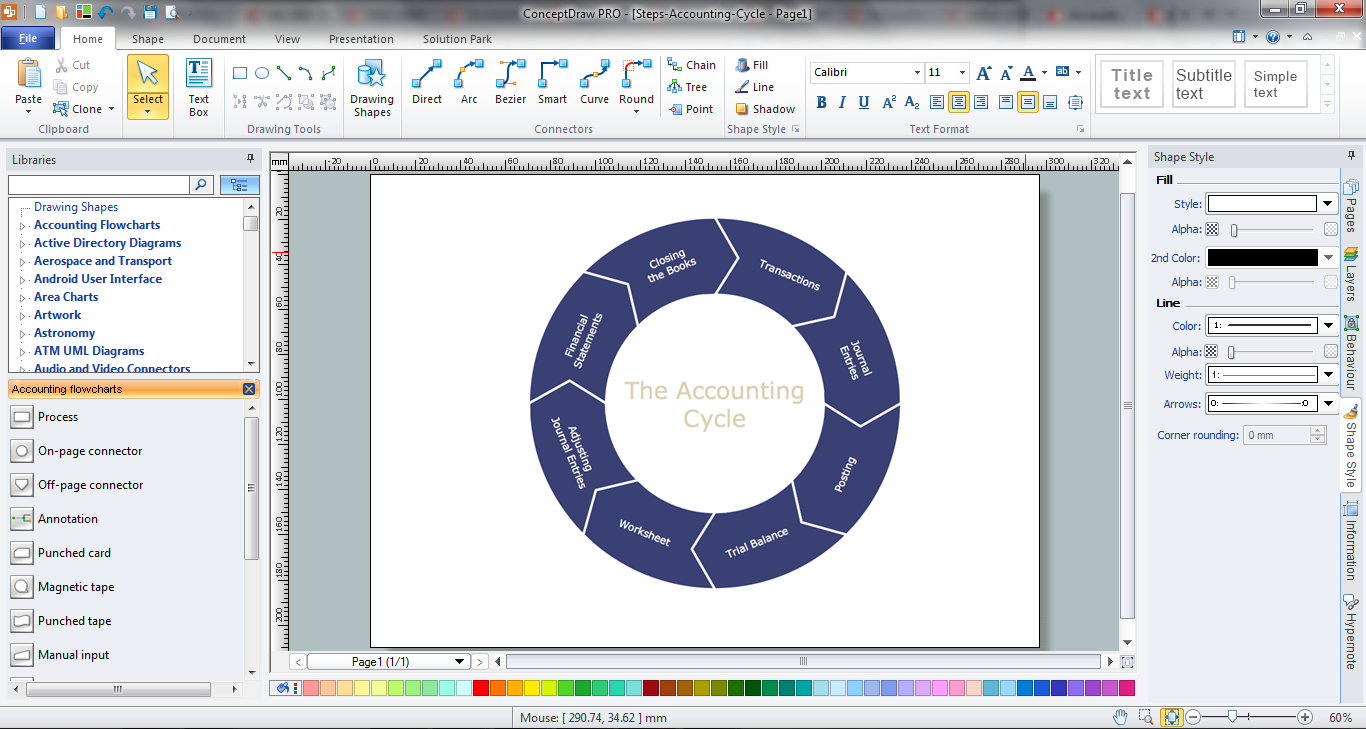
Example 1. Typography Infographics Solution in ConceptDraw STORE

Use of predesigned examples as the base for your own Typography Infographics is a timesaving and useful way. Simply open the desired example, change for your needs and then successfully use it in any field of your activity.


Typography Infographic Examples *

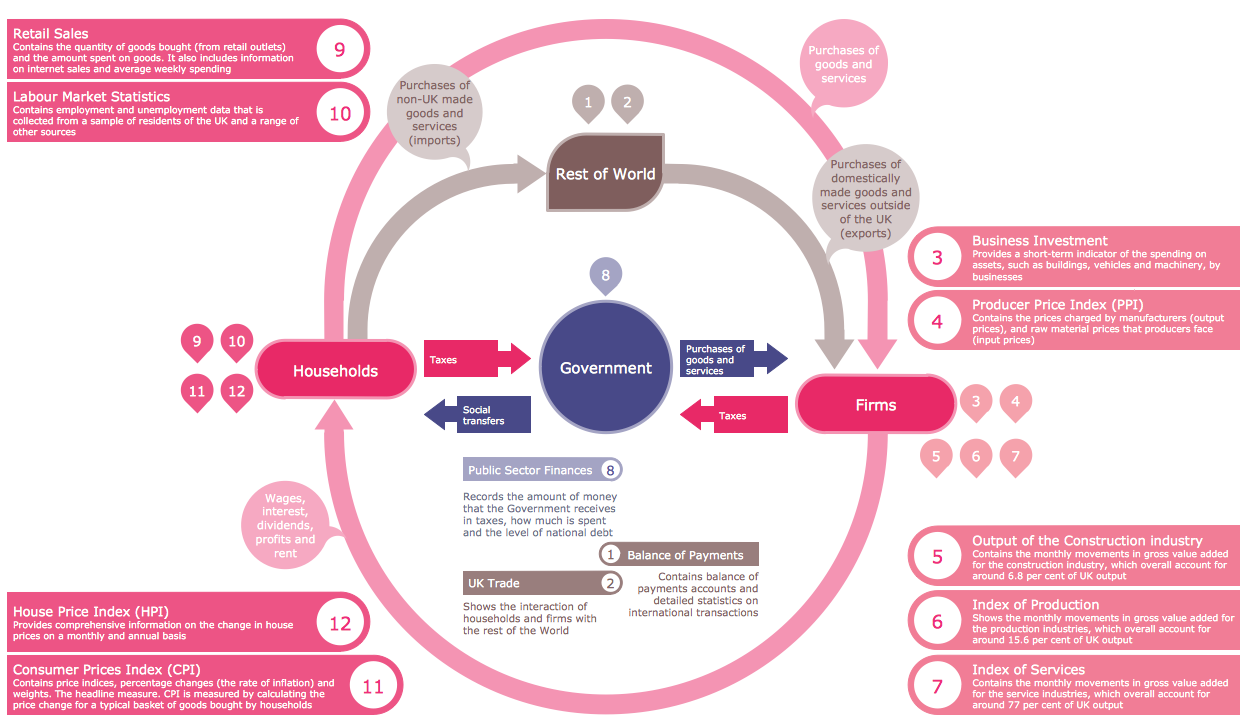
Example 2. Typography Infographic - UK Economy

This colorful Typography Infographic example was created in ConceptDraw DIAGRAM using the Typography Infographics Solution from the “Infographics” Area and shows the powerful capabilities of ConceptDraw DIAGRAM infographic software. An experienced user spent 20 minutes creating this sample.

Use the Typography Infographics Solution for ConceptDraw DIAGRAM to create your own professional looking Typography Infographics of any complexity quick, easy and effective.

The Typography Infographics designed with ConceptDraw DIAGRAM are vector graphic documents and are available for reviewing, modifying, converting to a variety of formats (image, HTML, PDF file, MS PowerPoint Presentation, Adobe Flash or MS Visio), printing and send via e-mail in one moment.


FIVE RELATED HOW TO's:
Event-Driven Process Chain Diagrams for improvement throughout an organisation. ConceptDraw DIAGRAM - software that reduces the time needed to create a business process model.Beauty of Event-driven Process Chain (EPC) diagrams *
Picture: Beauty of Event-driven Process Chain (EPC) diagrams
Related Solution:
The Circle Diagrams are the diagrams which represent the central element surrounded by other items in a circle. This type of diagram is very popular and widely used in marketing and management, for process modeling, market, resource, time and cost analysis, for visualization causes and effects. If you dream to design the Circle Diagrams quick and easy – the ConceptDraw DIAGRAM software extended with Business Diagrams Solution from the Management Area is exactly what you need.Circle Diagrams - Diagram Leadership and Data
Picture: Circle Diagrams
Related Solution:
What is a Work Flow Chart? It is a chart which visually displays the step-by-step transferring of data, documents and tasks during the work. ConceptDraw DIAGRAM extended with Workflow Diagrams solution from the Business Processes area of ConceptDraw Solution Park is the best software for drawing the Work Flow Chart of any complexity.Work Flow Chart *
Picture: Work Flow Chart
Related Solution:
This sample shows the Scatter Plot without missing categories. It’s very important to no miss the data, because this can have the grave negative consequences. The data on the Scatter Chart are represented as points with two values of variables in the Cartesian coordinates. This sample can be used in the engineering, business, statistics, analytics, at the creating the financial and other types of reports.Blank Scatter Plot *
Picture: Blank Scatter Plot
Related Solution:
Accounting cycle is a sequence of activities which are involved in completing an accounting process. The length of an accounting cycle is changed from organization to organization, this can be month, quarter, half-year, or year. ConceptDraw DIAGRAM diagramming and vector drawing software extended with Accounting Flowcharts Solution from the Finance and Accounting Area of ConceptDraw Solution Park offers the extensive drawing tools, library with ready-to-use vector elements which will help you design any accounting cycle example you need.Accounting Cycle Example *
Picture: Accounting Cycle Example
Related Solution:
ConceptDraw
DIAGRAM 18