How to Make a Timeline

HelpDesk
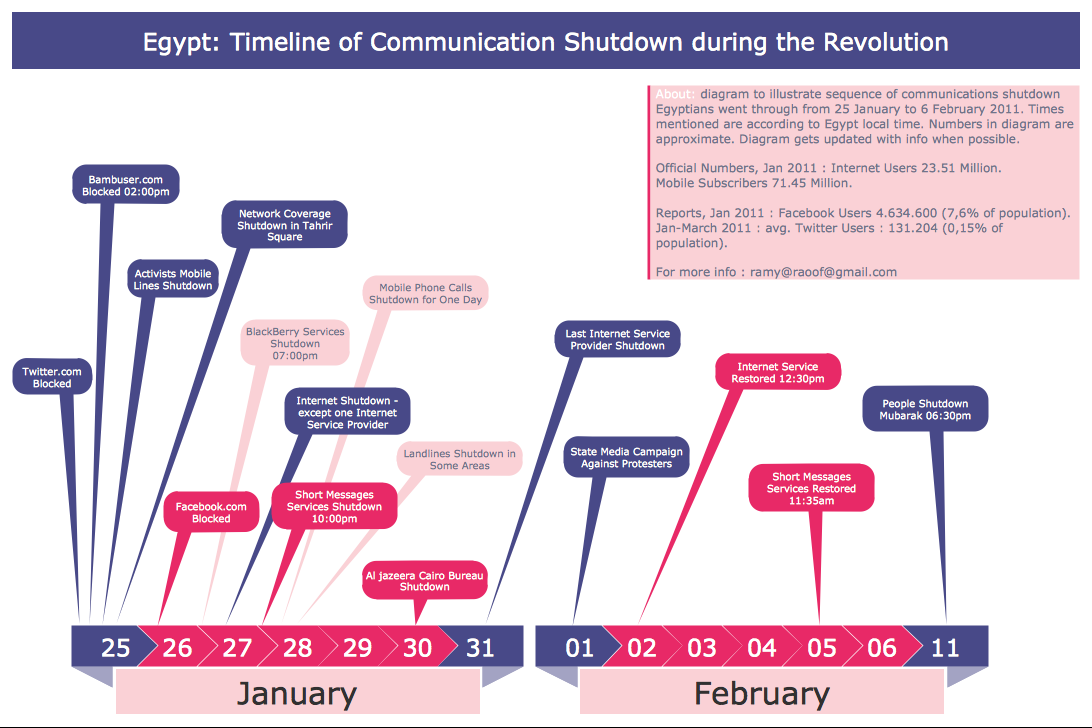
How to Create a Timeline Diagram

Timeline Examples

Project Timeline

You need to make professional looking project timeline? Create it with ConceptDraw DIAGRAM! ConceptDraw DIAGRAM extended with Timeline Diagrams Solution from the Management Area is the best timeline diagrams software
Timeline Diagrams

ConceptDraw DIAGRAM extended with Timeline Diagrams solution from the Management area of ConceptDraw Solution Park is a powerful software for fast and easy drawing useful and great-looking timeline diagrams.
 Business Processes
Business Process solution extends ConceptDraw DIAGRAM software with business process diagrams as cross-functional flowcharts, workflows, process charts, IDEF0, timelines, calendars, Gantt charts, business process modeling, audit and opportunity flowcharts.
HelpDesk
How to Shift Dates in ConceptDraw PROJECT

Business diagrams & Org Charts with ConceptDraw DIAGRAM


HelpDesk
What Information to be Displayed in the ConceptDraw PROJECT Gantt Chart View

Infographic Generator
Typography Infographics Solution offers you the best numerous collection of predesigned infographics examples and 9 libraries with large quantity of ready-to-use vector stencils that will help you design your own Typography Infographics of any complexity in minutes..
Gantt Chart Software

 PM Easy
PM Easy solution extends the ConceptDraw PROJECT functionality with an ability to support neutral methodology of project management and to quickly start a project by listing the task relationships and dependencies, that makes the iterative planning much easier. The project management tool and available visual tools, such as mind mapping, increase the effectiveness of tracking and analysis your project tasks. PM Easy solution from ConceptDraw Solution Park is mainly targeted at project managers in small or medium-sized companies, allowing them to make the project plan and execute projects using mind mapping technique, to implement planning using mind mapping, and to track tasks using ConceptDraw PROJECT application.
HelpDesk
How to Make a Mind Map from a Project Gantt Chart

Activity Network Diagram Method

This sample shows the PERT (Program Evaluation Review Technique) chart of the request on proposal. A request for proposal (RFP) is a request of the company or the organization to potential suppliers to submit the business proposals for service or goods that it is interested to purchase. The RFP is represented on the initial procurement stage and allows to define the risks and benefits.
- How to Make a Timeline | How to Create a Timeline Diagram in ...
- Timeline Diagrams | How to Create a Timeline Diagram in ...
- How to Make a Timeline | Timeline Diagrams | How to Create a ...
- Project plan timeline - Request for proposal (RFP) | Timeline ...
- Timeline Examples | How to Create a Timeline Diagram in ...
- How to Make a Timeline | Timeline Diagrams | Project Timeline ...
- How to Make a Timeline | Timeline Examples | Timeline Diagrams ...
- Design elements - Timelines and milestones | Project Timeline ...
- How to Make a Timeline | Project Timeline | Timeline Examples ...
- Project Timeline | How to Make a Timeline | Timeline Diagrams ...
- Timelines and milestones - Vector stencils library | How to Make a ...
- How to Make a Timeline | Project Timeline | Timeline Diagrams ...
- Timeline Diagrams | Line Graphs | How to Make a Timeline | Time ...
- Mac OS X User Interface | How to Make a Timeline | Program ...
- Timeline Examples | How to Make a Timeline | Timeline Diagrams ...
- Timeline Diagrams | How to Make a Timeline | Project Timeline ...
- Project Timeline | How to Make a Timeline | Timescale Marketing
- Timeline Diagrams | Management | How to Make a Timeline ...
- How to Make a Timeline | Area Charts | Project Timeline | How To ...
- Project Timeline | Timeline Diagrams | Timeline Examples | Project ...
- ERD | Entity Relationship Diagrams, ERD Software for Mac and Win
- Flowchart | Basic Flowchart Symbols and Meaning
- Flowchart | Flowchart Design - Symbols, Shapes, Stencils and Icons
- Flowchart | Flow Chart Symbols
- Electrical | Electrical Drawing - Wiring and Circuits Schematics
- Flowchart | Common Flowchart Symbols
- Flowchart | Common Flowchart Symbols