Timeline Examples

How to Make a Timeline

Timeline Diagrams

Project Timeline

The vector stencils library "Timelines and milestones" contains 24 shapes of time scales with start and finish dates, time interval bars with progress indication and brackets, milestone, event and today markers for drawing the timeline diagrams using the ConceptDraw PRO diagramming and vector drawing software.
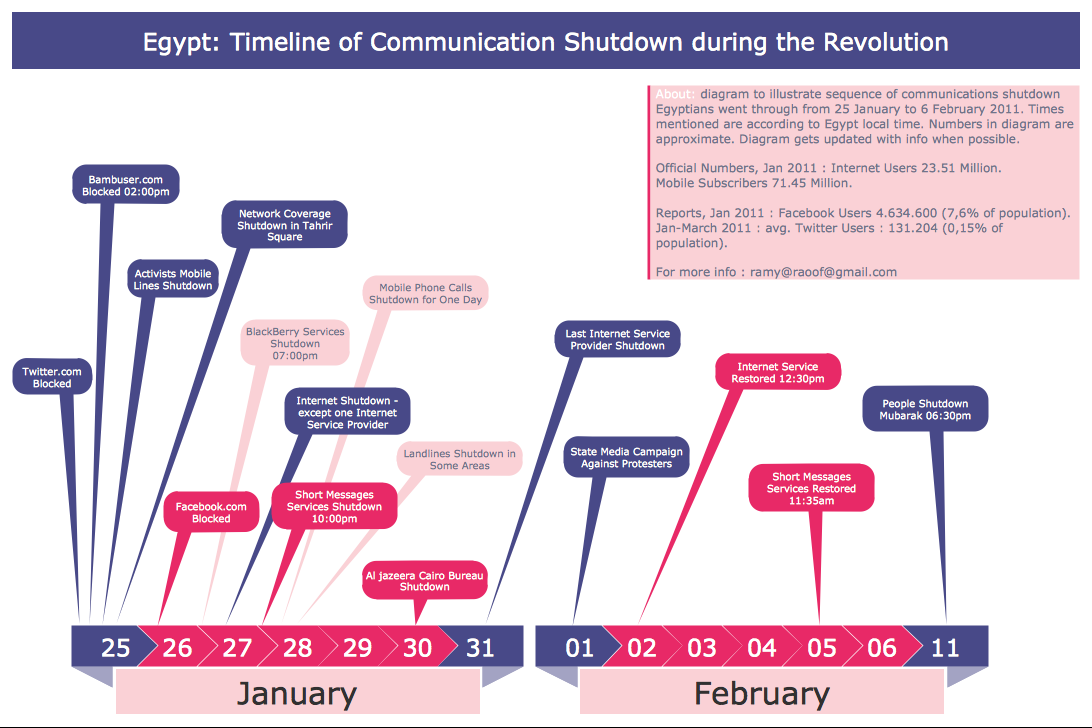
"A timeline is a way of displaying a list of events in chronological order, sometimes described as a project artifact. It is typically a graphic design showing a long bar labelled with dates alongside itself and (usually) events labelled on points where they would have happened. ...
Another type of timeline is used for project management. In these cases, timelines are used to help team members to know what milestones need to be achieved and under what time schedule. For example, in the case of establishing a project timeline in the implementation phase of the life cycle of a computer system." [Timeline. Wikipedia]
The example "Design elements - Timelines solution" is included in the Timeline Diagrams solution from the Management area of ConceptDraw Solution Park.
Timeline and milestone symbols

 Timeline Diagrams
Timeline Diagrams solution extends ConceptDraw DIAGRAM diagramming software with samples, templates and libraries of specially developed smart vector design elements of timeline bars, time intervals, milestones, events, today marker, legend, and many other elements with custom properties, helpful for professional drawing clear and intuitive Timeline Diagrams. Use it to design simple Timeline Diagrams and designate only the main project stages, or highly detailed Timeline Diagrams depicting all project tasks, subtasks, milestones, deadlines, responsible persons and other description information, ideal for applying in presentations, reports, education materials, and other documentation.
HelpDesk
How to Create a Timeline Diagram

Infographic Generator
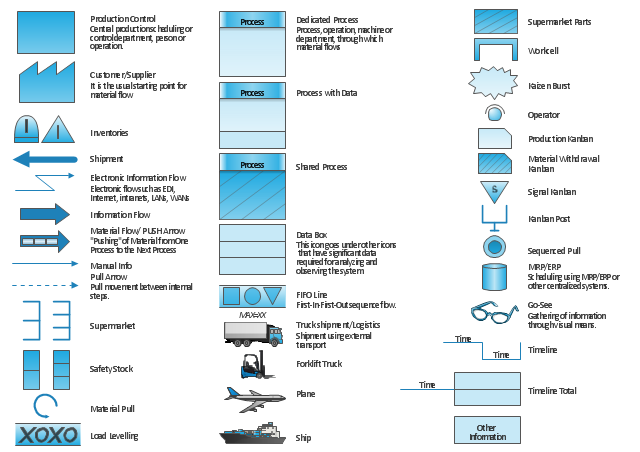
"Value Stream Mapping (VSM):
– Special type of flow chart that uses symbols known as "the language of Lean" to depict and improve the flow of inventory information. ...
Value Stream Mapping ...
Provide optimum value to the customer through a complete value creation process with minimum waste in:
– Design (concept to customer);
– Design (concept to customer);
– Build (order to delivery);
– Sustain (in-use through life cycle to service)." [courses.washington.edu/ ie337/ Value_ Stream_ Mapping.pdf]
This sample Value Stream Map shows how customer value is created in the steps of manufacturing, production control, and shipping processes.
This VSM example was created using the ConceptDraw PRO diagramming and vector drawing software extended with the Value Stream Mapping solution from the Quality area of ConceptDraw Solution Park.
Value stream mapping

Examples of Flowcharts, Org Charts and More


"Value stream mapping usually employs standard symbols to represent items and processes, therefore knowledge of these symbols is essential to correctly interpret the production system problems." [Value stream mapping. Wikipedia]
The vector stencils library Value stream mapping contains 43 symbols for drawing the value stream mapping diagrams using the ConceptDraw PRO diagramming and vector drawing software.
The example "Design elements - Value stream mapping diagram" is included in the Value Stream Mapping solution from the Quality area of ConceptDraw Solution Park.
VSM symbols
UML Class Diagram Example - Buildings and Rooms

Business diagrams & Org Charts with ConceptDraw DIAGRAM


Business Process Mapping — How to Map a Work Process

- How to Make a Timeline | Timeline Examples | Design elements ...
- Project timeline diagram | Design elements - Timelines solution ...
- Design elements - Timelines and milestones | Project Timeline ...
- Design elements - Timelines and milestones | Timeline Diagrams ...
- Timeline Diagrams | How to Make a Timeline | How to Create a ...
- Activity Network Diagram Method | Timeline Diagrams | Process ...
- Timeline Free Samples
- Project Timeline | Timeline Diagrams | Business diagrams & Org ...
- Timeline Drawing Examples
- Timeline Diagrams | Timeline Examples | How to Create a Timeline ...
- Project Timeline | Timeline Examples | Examples of Flowcharts, Org ...
- Timeline diagram template | Design elements - Timelines solution ...
- Timeline Diagrams | Timeline Examples | How to Create a Timeline ...
- Timeline Diagrams | Timeline Examples | How to Create a Timeline ...
- Sample Timeline For Visio
- SmartAmerica Challenge - Timeline | Timeline Diagrams ...
- How to Make a Timeline | Timeline Diagrams | Project Timeline ...
- Timeline Examples | How to Create a Timeline Diagram in ...
- Timeline Diagrams | Timeline Examples | Timeline Diagrams ...
- Timeline Diagrams | Value stream map example | Business ...