This flow chart sample was drawn on the base on the illustration of the article "Climate change impact on China food security in 2050" from the website of Chinese Academy of Agricultural Sciences .
[caas.cn/ en/ newsroom/ research_ update/ 67347.shtml]
"Food security is a condition related to the ongoing availability of food. ...
According to the Food and Agriculture Organization (FAO), food security "exists when all people, at all times, have physical and economic access to sufficient, safe and nutritious food to meet their dietary needs and food preferences for an active and healthy life". ...
Extreme events, such as droughts and floods, are forecast to increase as climate change takes hold. Ranging from overnight floods to gradually worsening droughts, these will have a range of impacts on the agricultural sector. ...
According to the Climate & Development Knowledge Network report Managing Climate Extremes and Disasters in the Agriculture Sectors: Lessons from the IPCC SREX Report, the impacts will include changing productivity and livelihood patterns, economic losses, and impacts on infrastructure, markets and food security. Food security in future will be linked to our ability to adapt agricultural systems to extreme events." [Food security. Wikipedia]
The flowchart example "Food security assessment" was created using the ConceptDraw PRO diagramming and vector drawing software extended with the Flowcharts solution from the area "What is a Diagram" of ConceptDraw Solution Park.
Flowchart

Process Engineering

 ConceptDraw Solution Park
ConceptDraw Solution Park collects graphic extensions, examples and learning materials
 Sustainable Development
The Sustainable Development solution extends ConceptDraw DIAGRAM with a set of pre-made samples and a large collection of predesigned objects, symbols, and pictograms for designing professionally looking diagrams related to sustainable development, its processes, goals, methods, and ways for their achievement. This solution is really helpful to create schematics and designs illustrating the main points of sustainable development, social sustainability, narrating about sustainable energy and sources of green energy. It is useful to develop sustainable development plans that need to be implemented to ensure the safety of nature, list the UN sustainable development goals, draw up a plan for building a smart city and implementing the principles of sustainable agriculture, and other important information.
Flow chart ExampleWarehouse Flowchart


 Internet of Things
The Internet of Things solution extends ConceptDraw DIAGRAM with a set of samples and a wide collection of predesigned special clipart, pictograms, and symbols of IoT sensors, IoT devices, smart appliances, retail, industrial, and agricultural IoT devices, and many other IoT objects. This solution is incredibly helpful for designing the Internet of Things (IoT) and Web of Things (WoT) diagrams and infographics of different complexity for numerous areas and industries. It is incredibly useful for engineers, designers, electricians, mechanics, developers, technicians, electronics, and safety-related specialists.
 Critical Infrastructure Sectors
Critical Infrastructure Sectors solution for ConceptDraw DIAGRAM software provides a set of examples and vector stencil libraries for designing infographics and diagrams about means for the most efficient protection of critical infrastructure, energy sector, and rapid recovery in the case of disruptions. Illustrate your projects on the prevention of physical, environmental, and cyber threats, development of information technology and detection equipment. Improve your projects in communications, financial services, emergency services, homeland security, cybersecurity to solve critical issues efficiently and decrease the detrimental effects of disruptions on society and citizens. Show the results of testing new technologies and newest equipment for critical infrastructure protection and increasing resilience.
 Genogram
Genogram solution including professionally designed genogram samples and a wide range of high-quality vector design elements of genogram symbols, medical genogram symbols, emotional relationships and family relationships, makes the ConceptDraw DIAGRAM software the best for drawing the informative Genograms, genealogy schematics and illustrations, and family tree of any depth, and for any quantity of generations. It perfectly suits for the medical specialists of different profiles, medical consultants, therapists, genetics, psychologists, and other medical professionals, each individual and couple.
 Packages Area
We are excited to introduce a new Bundles Catalogue, where ConceptDraw products are paired together or offered with thematic set of paid solutions.
 Marketing Diagrams
Marketing Diagrams solution extends ConceptDraw DIAGRAM diagramming software with abundance of samples, templates and vector design elements intended for easy graphical visualization and drawing different types of Marketing diagrams and graphs, including Branding Strategies Diagram, Five Forces Model Diagram, Decision Tree Diagram, Puzzle Diagram, Step Diagram, Process Chart, Strategy Map, Funnel Diagram, Value Chain Diagram, Ladder of Customer Loyalty Diagram, Leaky Bucket Diagram, Promotional Mix Diagram, Service-Goods Continuum Diagram, Six Markets Model Diagram, Sources of Customer Satisfaction Diagram, etc. Analyze effectively the marketing activity of your company and apply the optimal marketing methods with ConceptDraw DIAGRAM software.
Bar Diagrams for Problem Solving. Create economics and financial bar charts with Bar Graphs Solution

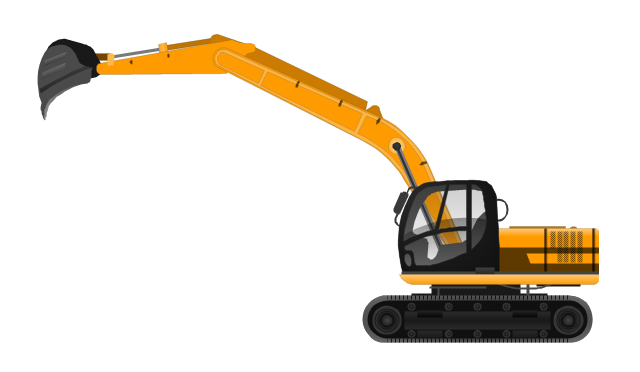
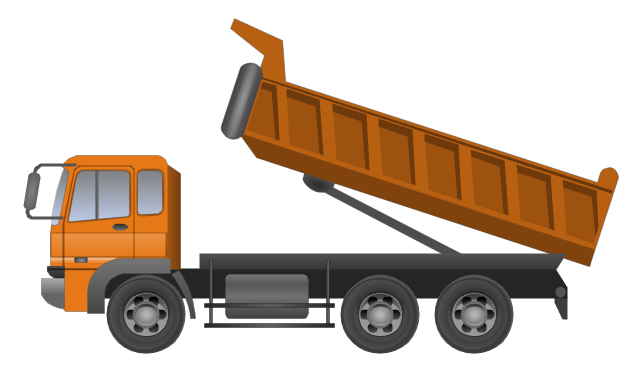
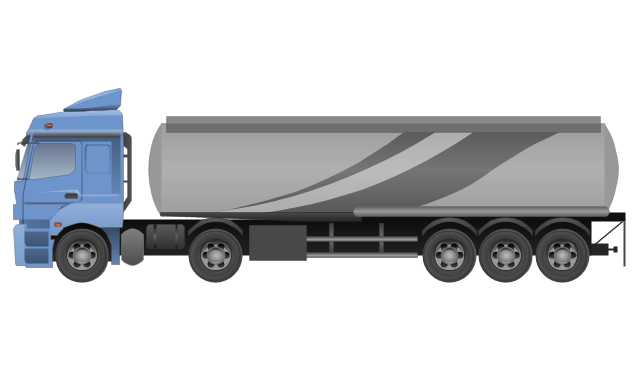
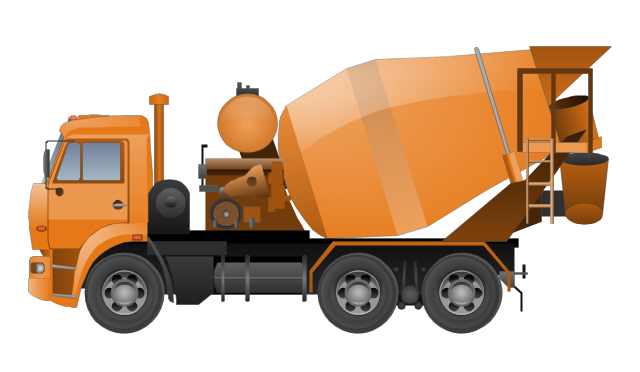
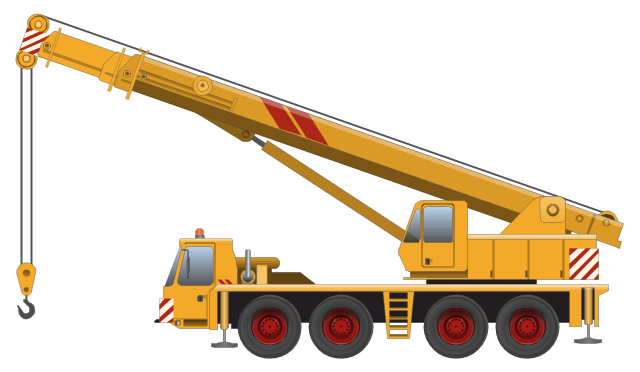
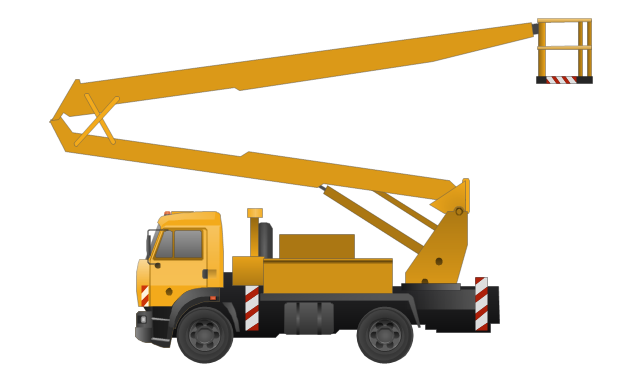
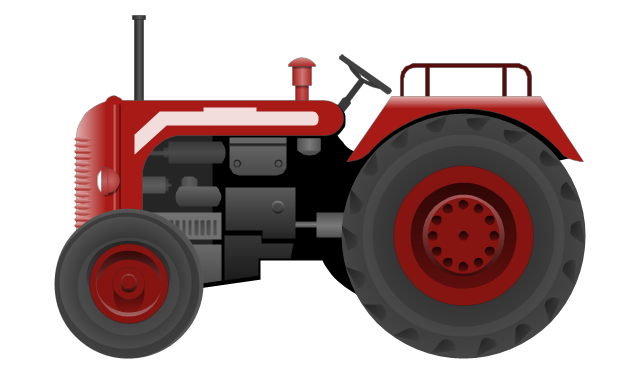
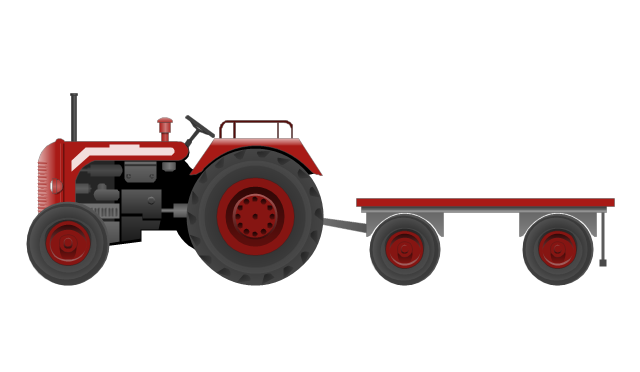
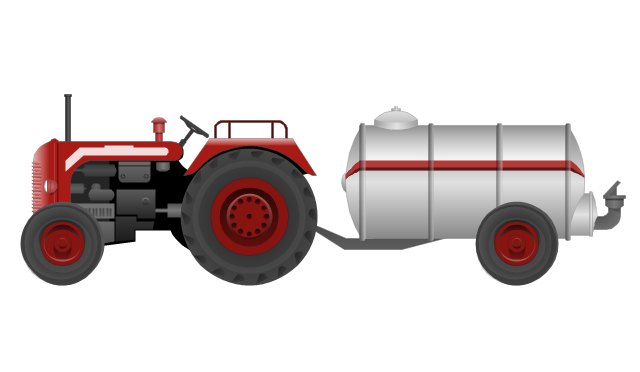
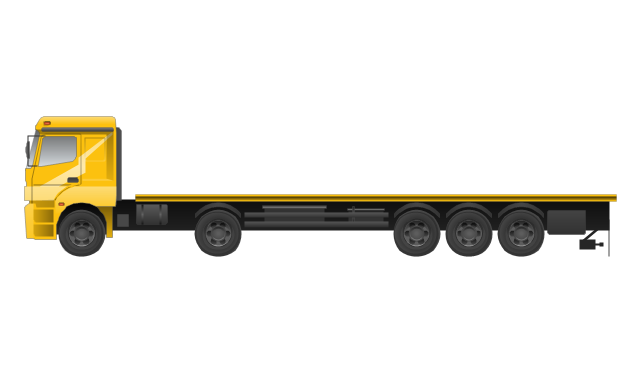
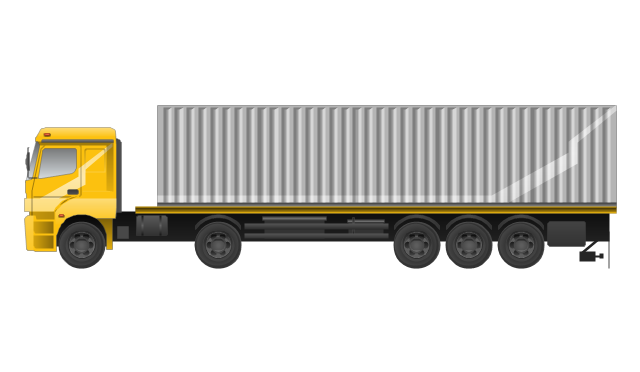
The vector stencils library "Industrial vehicles" contains 14 clipart images of industrial and building vehicles for drawing illustrations.
"A truck (US, CA, AU, NZ) or lorry (UK and Ireland) is a motor vehicle designed to transport cargo. Trucks vary greatly in size, power, and configuration, with the smallest being mechanically similar to an automobile. Commercial trucks can be very large and powerful, and may be configured to mount specialized equipment, such as in the case of fire trucks and concrete mixers and suction excavators. Modern trucks are largely powered by diesel engines exclusively, although small to medium size trucks with gasoline engines exist in America. In the European Union vehicles with a gross combination mass of less than 3,500 kilograms (7,716 lb) are known as light commercial vehicles and those over as large goods vehicles." [Truck. Wikipedia]
The clip art example "Industrial vehicles - Vector stencils library" was created in the ConceptDraw PRO diagramming and vector drawing software using the Manufacturing and Maintenance solution from the Illustration area of ConceptDraw Solution Park.
Excavator
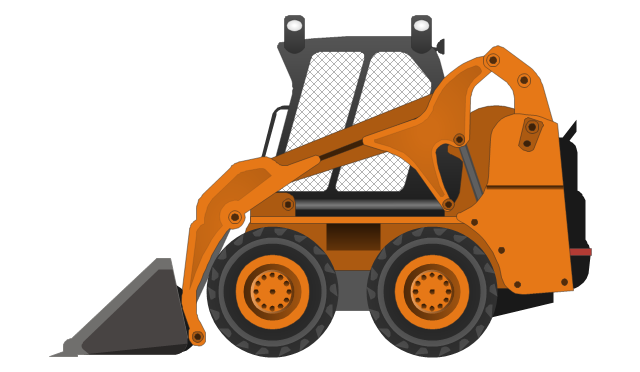
Bucket loader
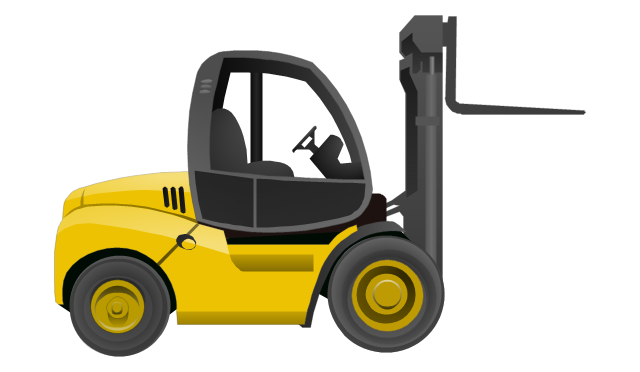
Forklift truck
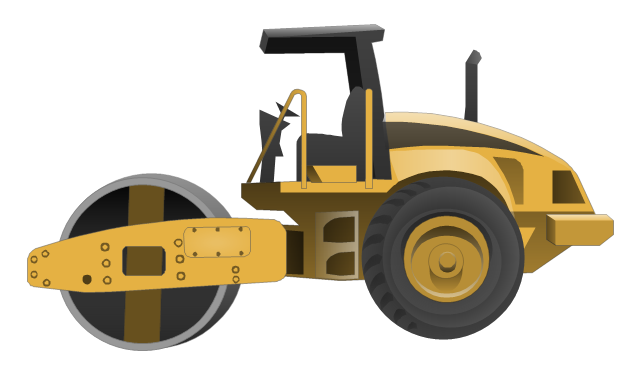
Road roller
Dumper truck
Tank truck
Concrete mixing transport truck
Truck-mounted crane
Aerial work platform
Tractor
Tractor with a trailer
Tractor with a petrol tanker
Full trailer truck
Trailer with container
Healthy Diet Plan

The vector stencils library "Picture Graphs" contains 35 templates of picture bar graphs for visual data comparison and time series.
Drag a template from the library to your document, set bars number, type category labels, select bars and enter your data.
Use these shapes to draw your pictorial bar charts in the ConceptDraw PRO diagramming and vector drawing software.
The vector stencils library "Picture Graphs" is included in the Picture Graphs solution from the Graphs and Charts area of ConceptDraw Solution Park.
Arrow
Water drop

Food

Grain

Agriculture

Medicines

Houses

Buildings

Money bags

Oil barrels

Natural gas

Electrical power

Nuclear power

Mechanical engineering

Chemical industry

Mining

Gold bars

Coins

Person

Men, women and children

Man

Woman

Child

Milk

Meat

Fruits

Vegetables

Computer

Mobile phone

Airliner

Car

Bus

Truck

Train

Cargo ship

Bar Graph

 Picture Graphs
Typically, a Picture Graph has very broad usage. They many times used successfully in marketing, management, and manufacturing. The Picture Graphs solution extends the capabilities of ConceptDraw DIAGRAM with the quick-start templates, samples, and a library of professionally developed vector stencils for designing attractive, colorful and remembered Picture Graphs on any thematic.
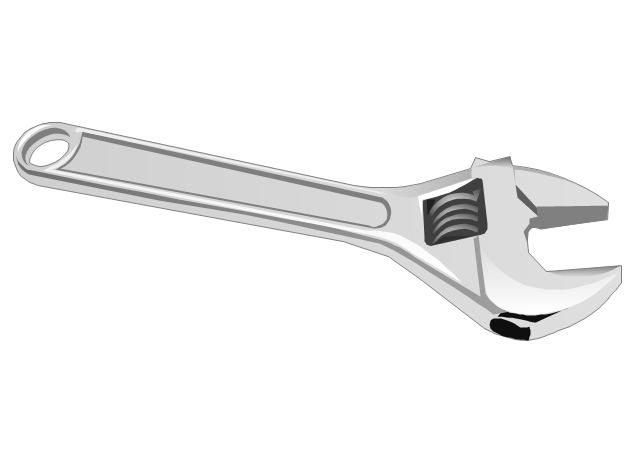
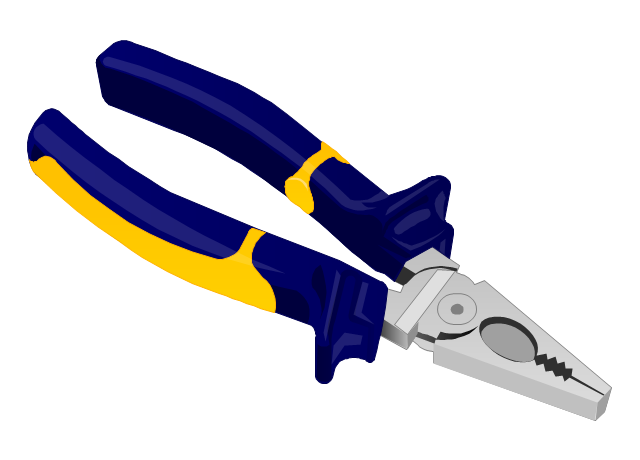
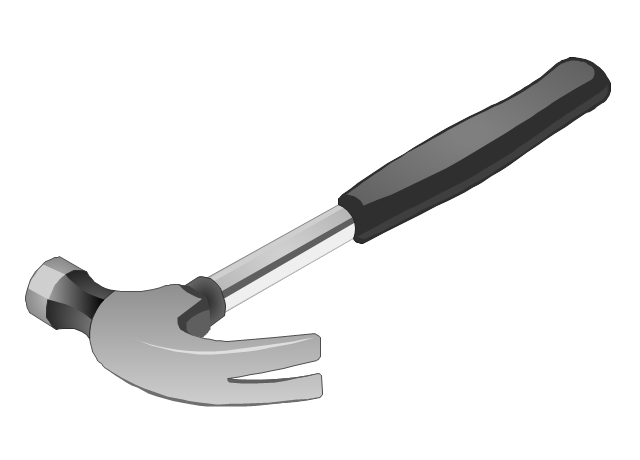
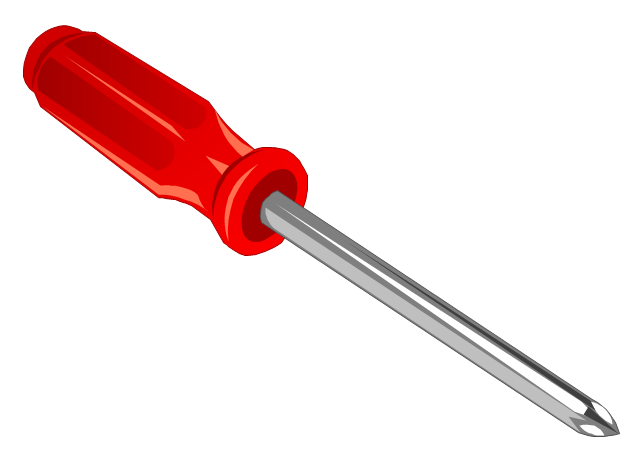
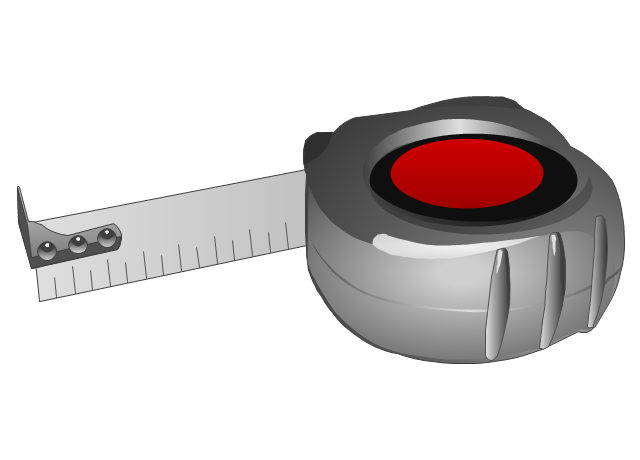
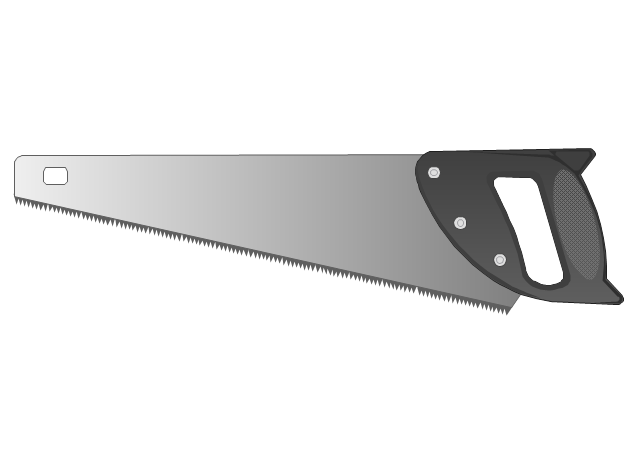
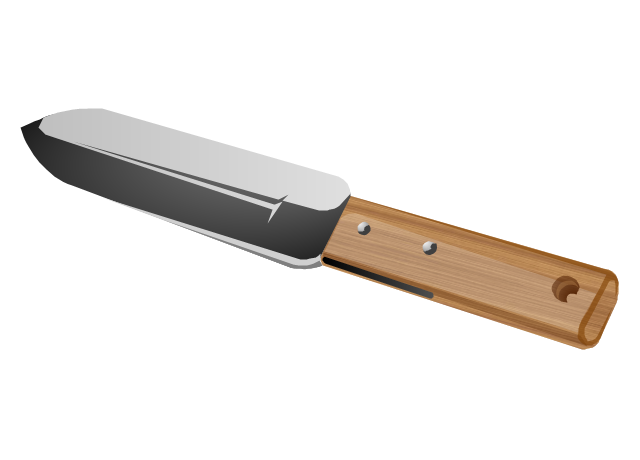
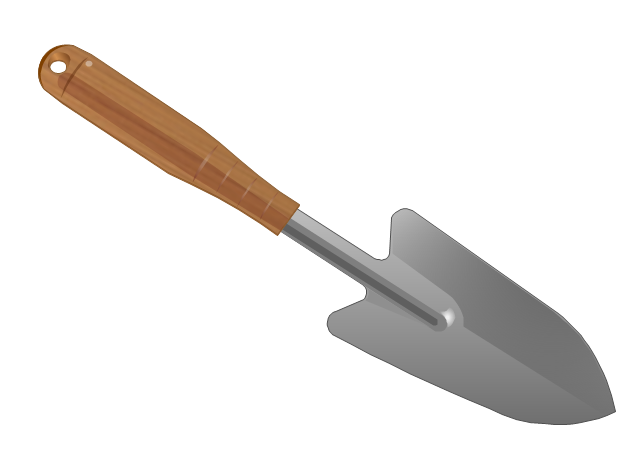
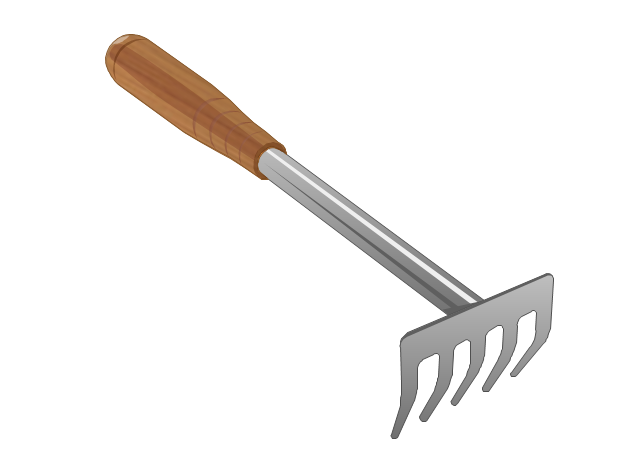
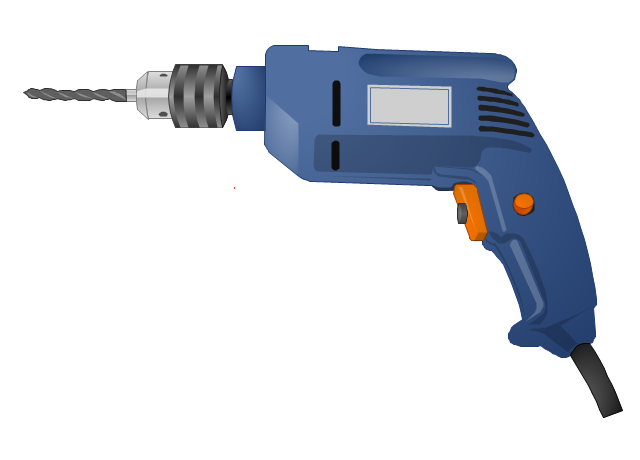
The vector stencils library "Tools" contains 11 clipart images of hand tools and instruments for drawing illustrations.
"A tool is any physical item that can be used to achieve a goal, especially if the item is not consumed in the process. Informally the word is also used to describe a procedure or process with a specific purpose. Tool use by humans dates back millions of years, and other animals are also known to employ simple tools.
Tools that are used in particular fields or activities may have different designations such as "instrument", "utensil", "implement", "machine", or "apparatus". The set of tools needed to achieve a goal is "equipment". The knowledge of constructing, obtaining and using tools is technology." [Tool. Wikipedia]
The clip art example "Tools - Vector stencils library" was created in ConceptDraw PRO diagramming and vector drawing software using the Manufacturing and Maintenance solution from the Illustration area of ConceptDraw Solution Park.
Adjustable spanner
Lineman's pliers
Claw hammer
Phillips screwdriver
Self-retracting tape measure
Crosscut hand saw
Nail

Hori-Hori garden knife
Gardening trowel
Garden rake
Pistol-grip electric drill
How To Create Home Plan with Examples


Bar Diagrams for Problem Solving. Create manufacturing and economics bar charts with Bar Graphs Solution

- Food security assessment - Flowchart | Flowcharts | Flowchart Of ...
- Flowcharts | Agriculture As A System Illustrate Through Flaw Chart
- Flowchart Related To Agriculture Extension
- Food security assessment - Flowchart | Agriculture Flowchart Draw
- Flow chart Example. Warehouse Flowchart | Flow Chart Of ...
- Area Charts | Cross Functional Flowchart Examples | Draw The ...
- Marketing Diagrams | Cross Functional Flowchart Examples | Area ...
- Marketing Diagrams | USDA's Enterprise Architecture | Flow chart ...
- Flowcharts | Explain Agriculture As A System Illustrate Throught ...
- Flow chart Example. Warehouse Flowchart | Bar Diagrams for ...