 Marketing Diagrams
Marketing Diagrams solution extends ConceptDraw DIAGRAM diagramming software with abundance of samples, templates and vector design elements intended for easy graphical visualization and drawing different types of Marketing diagrams and graphs, including Branding Strategies Diagram, Five Forces Model Diagram, Decision Tree Diagram, Puzzle Diagram, Step Diagram, Process Chart, Strategy Map, Funnel Diagram, Value Chain Diagram, Ladder of Customer Loyalty Diagram, Leaky Bucket Diagram, Promotional Mix Diagram, Service-Goods Continuum Diagram, Six Markets Model Diagram, Sources of Customer Satisfaction Diagram, etc. Analyze effectively the marketing activity of your company and apply the optimal marketing methods with ConceptDraw DIAGRAM software.
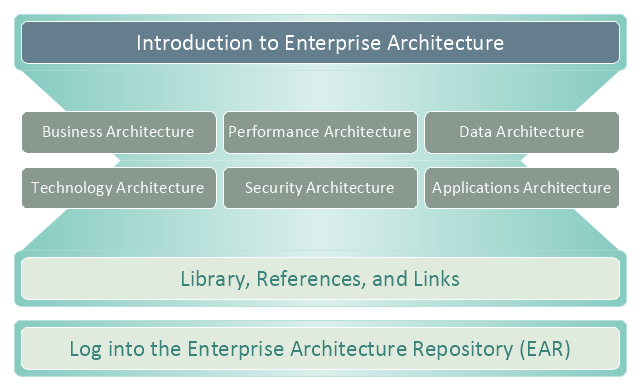
This enterprise architecture diagram sample was drawn on the base of the figure illustrating the webpage "Enterprise Architecture" from the United States Department of Agriculture (USDA) website.
"The USDA's Enterprise Architecture program strategically partners with all agencies to provide value to USDA's mission areas, business processes, and Information Technology (IT) capabilities.
Introduction.
The USDA Enterprise Architecture (EA) helps make sure information technology investments align with the mission and goals of the Department. It defines how information and technology should support USDA’s strategic goals and benefit the business.
Purpose.
The intent of the USDA Enterprise Architecture is to help make the information technology (IT) expenditures more effectively serve the mission and goals of the organization. Enterprise architecture defines how information and technology support USDA’s strategic planning to benefit our business. There are many ways to organize the information and diagrams that make up the architecture."
[ocio.usda.gov/ about-ocio/ governance-and-strategic-investment-gsi/ enterprise-architecture]
The enterprise architecture diagram example "USDA's Enterprise Architecture" was created using the ConceptDraw PRO diagramming and vector drawing software extended with the Enterprise Architecture Diagrams solution from the Management area of ConceptDraw Solution Park.
Enterprise architecture diagram
Flow chart Example. Warehouse Flowchart


Electrical Symbols, Electrical Diagram Symbols

Example of DFD for Online Store (Data Flow Diagram)


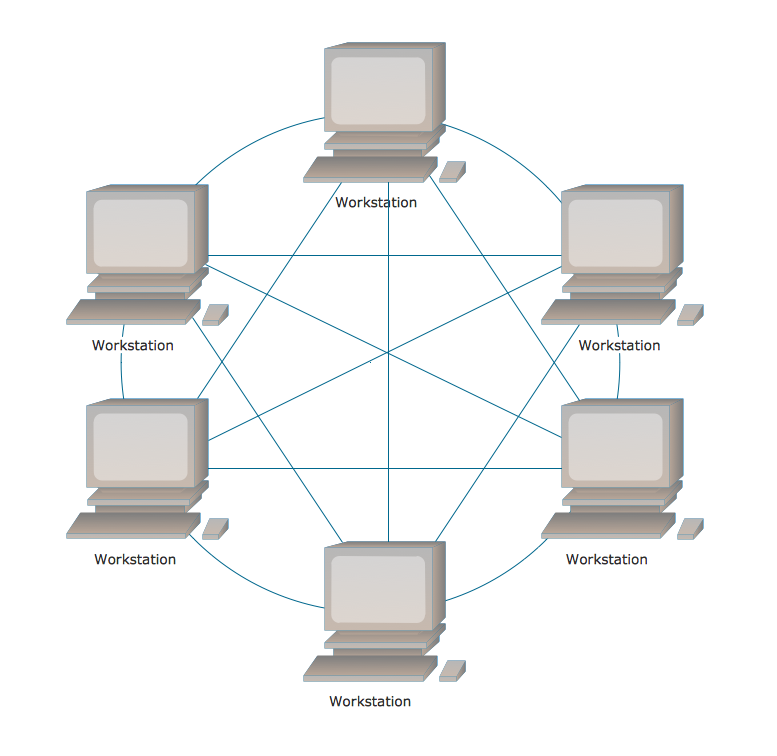
Fully Connected Network Topology Diagram
Bar Diagrams for Problem Solving. Create economics and financial bar charts with Bar Graphs Solution

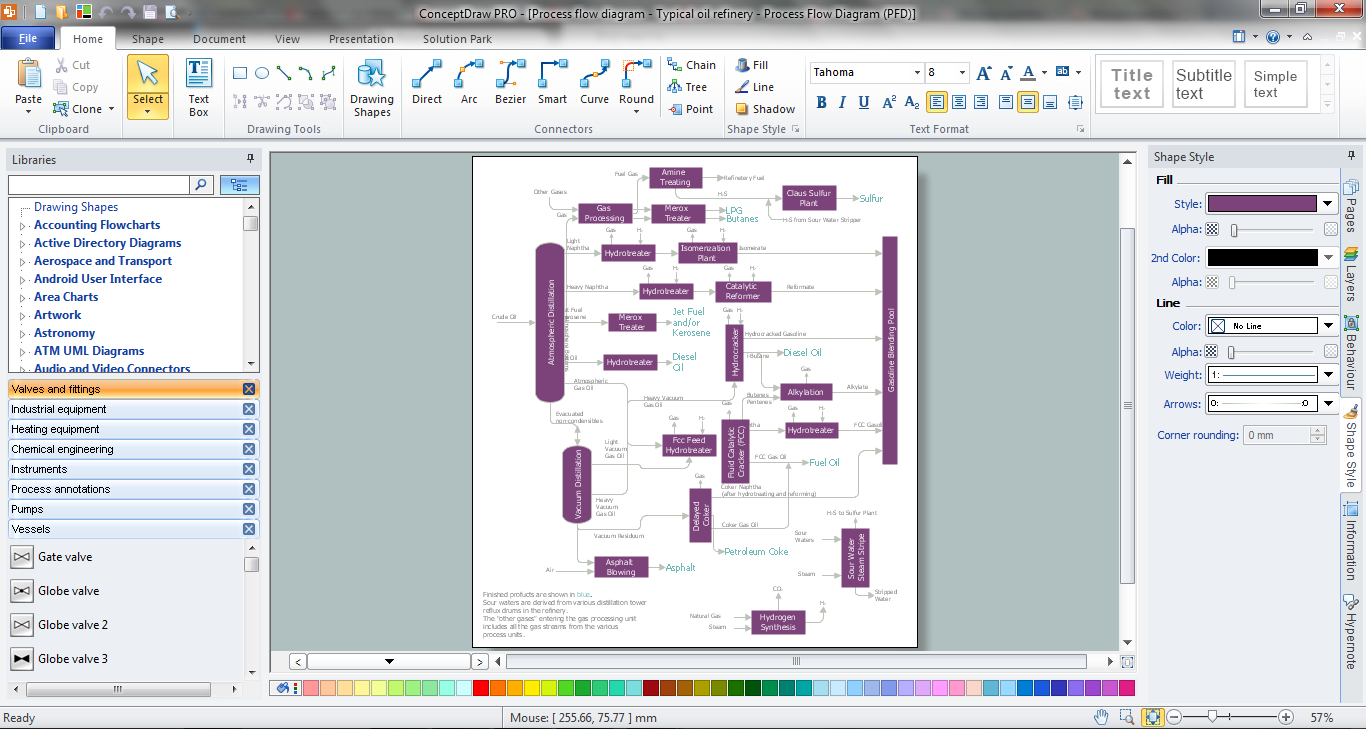
Process Engineering
 Area Charts
Area Charts are used to display the cumulative totals over time using numbers or percentages; or to show trends over time among related attributes. The Area Chart is effective when comparing two or more quantities. Each series of data is typically represented with a different color, the use of color transparency in an object’s transparency shows overlapped areas and smaller areas hidden behind larger areas.
Diagram Software - The Best Choice for Diagramming

- Flowcharts | Class Diagram For Agriculture Management System
- Flow Chart On Agriculture
- Area Charts | Bar Graph Of Agriculture In India
- Agriculture Marketing Diagram
- Use Case Diagram For Agriculture Management System
- Dfd Diagrams For Agriculture System
- Area Charts | Bar Diagram Of Planning In Agriculture In India
- Agriculture Of India Pie Diagram
- Draw A Flow Chart On Agriculture
- Bar Diagram In Agriculture Examples