Accounting Flowchart Purchasing Receiving Payable and Payment

Workflow to Make a Purchase. Accounting Flowchart Example

Sales Process Flowchart Symbols

What can go wrong if the purchasing process is not followed?

Accounting Flowchart: Purchasing, Receiving, Payable and Payment

 Sales Flowcharts
The Sales Flowcharts solution lets you create and display sales process maps, sales process workflows, sales steps, the sales process, and anything else involving sales process management.
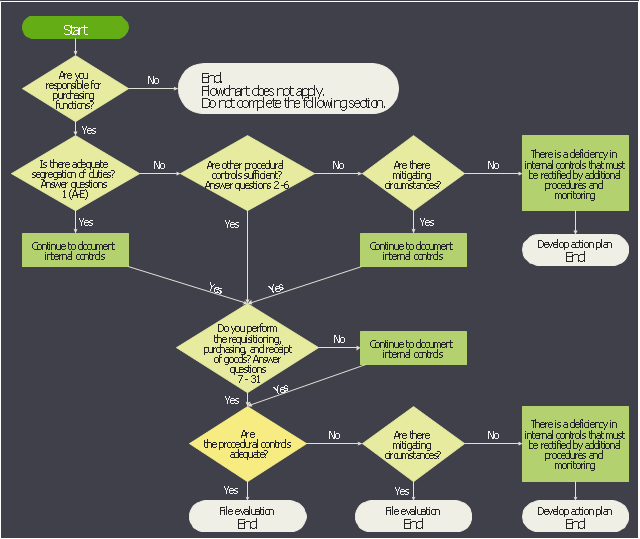
This accounting flowchart example was created on the base of the figure from the website of the Office of the State Comptroller. [osc.ct.gov/ manuals/ acctdirect/ question03.htm]
"Purchasing is the formal process of buying goods and services. The purchasing process can vary from one organization to another, but there are some common key elements.
The process usually starts with a demand or requirements – this could be for a physical part (inventory) or a service. A requisition is generated, which details the requirements (in some cases providing a requirements speciation) which actions the procurement department. A request for proposal (RFP) or request for quotation (RFQ) is then raised. Suppliers send their quotations in response to the RFQ, and a review is undertaken where the best offer (typically based on price, availability and quality) is given the purchase order." [Purchasing process. Wikipedia]
The accounting flowchart example "Purchasing flowchart" was created using the ConceptDraw PRO software extended with the Accounting Flowcharts solution from the Finance and Accounting area of ConceptDraw Solution Park.
Accounting flowchart
How to Create Flowcharts for anAccounting Information System

Why is it important to have a formal purchasing process?

Accounting Flowchart

Purchasing Flow Chart. Purchasing Flowchart Example

Purchasing Flowchart - Purchase OrderFlowchart Examples

Flowchart Components

Process Flow Chart Symbol

TQM Diagram Example

HR Department Flow Chart

Basic of Flowchart: Meaning and Symbols


How to Make an Accounting Process Flowchart

ConceptDraw MINDMAP : Brainstorming, Mind Mapping for macOS and Windows

Technical Flow Chart Example

- Accounting Flowchart : Purchasing , Receiving, Payable and ...
- Purchasing flowchart | Trading process diagram - Deployment ...
- Purchase Process Flow Chart , Receiving Process Flow Chart ...
- Accounting Flowchart : Purchasing , Receiving, Payable and ...
- How to Draw an Organization Chart | How to Create Flowcharts for ...
- Cross-Functional Flowchart | Purchasing Flowchart - Purchase ...
- Process Flowchart | Business Process Mapping | Cross-Functional ...
- Cross-Functional Flowchart | Process Map For Purchase Department
- Process Flowchart | Material Requisition Flowchart . Flowchart ...
- Flowchart Symbols Accounting. Activity-based costing (ABC ...