How to Create a Social Media DFD Flowchart

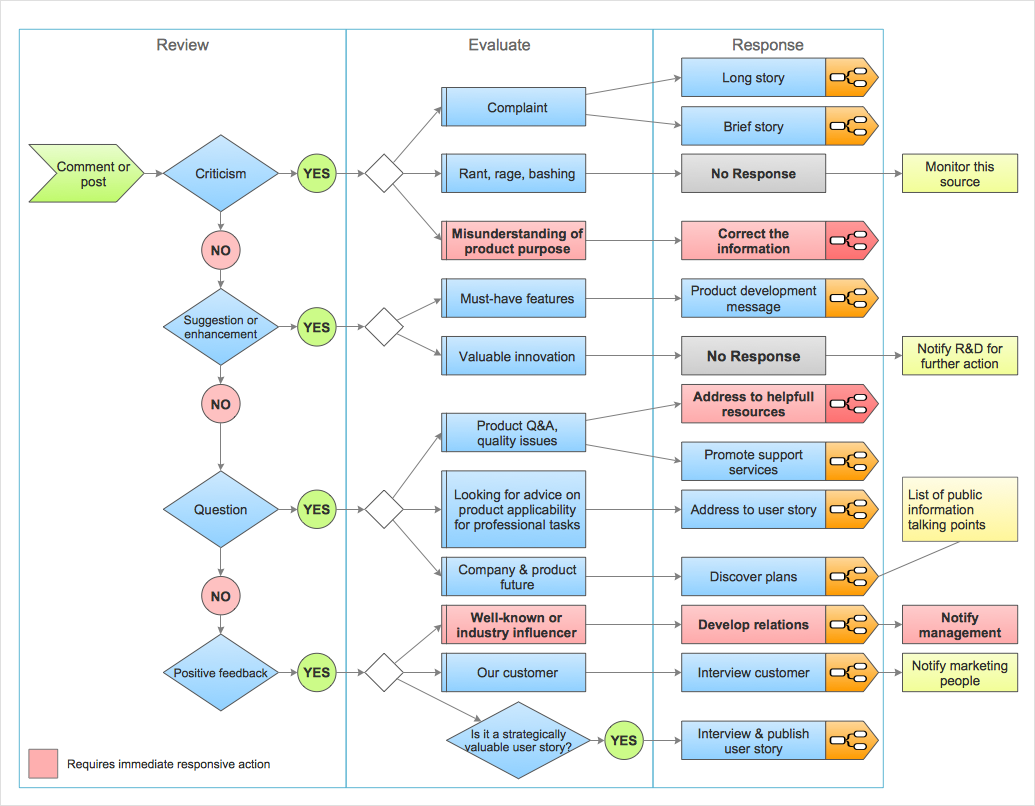
 Social Media Response
This solution extends ConceptDraw DIAGRAM and ConceptDraw MINDMAP with the ability to draw interactive flow charts with action mind map templates, to help create an effective response to applicable social media mentions.
Social Media Flowchart Symbols

Business Diagram Software


HelpDesk
How to Organize a Social Media Activity
HelpDesk
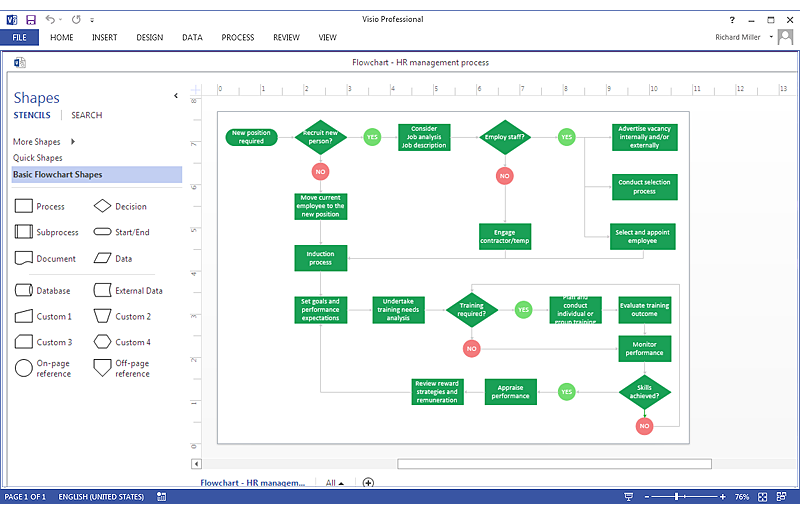
How To Create MS Visio Cross-Functional Flowchart

HelpDesk
How To Create MS Visio Flowchart
HelpDesk
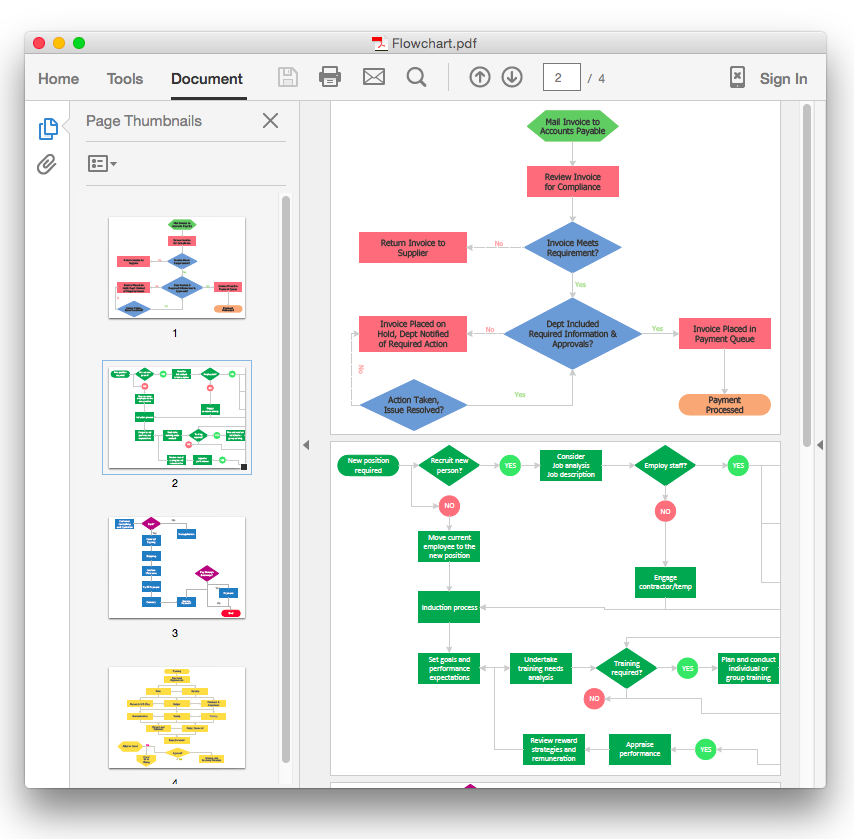
How To Convert a Flowchart to Adobe PDF
HelpDesk
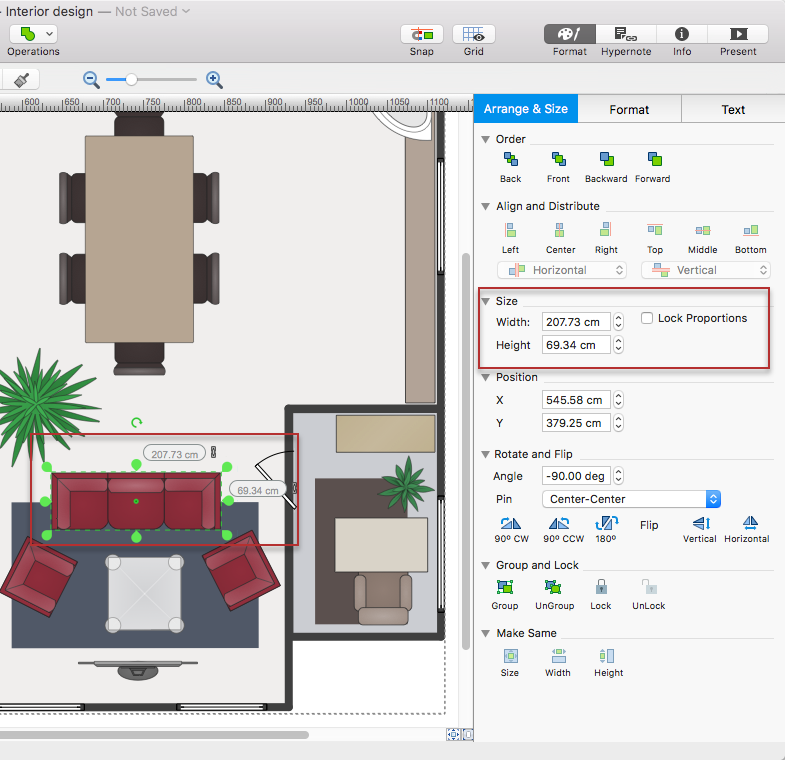
How to Change the Measurement Units and Drawing Scale
Comparing ConceptDraw DIAGRAM to Omnigraffle

HelpDesk
How to Simplify Flow Charting on Mac

HelpDesk
How to Draw a Chemical Process Flow Diagram

HelpDesk
How to Create Flowchart Using Standard Flowchart Symbols
HelpDesk
How to Import MS Project File to a Mind Map Using the Project Exchange Solution

- How to Create a Social Media DFD Flowchart | Business Diagram ...
- Social Media Response Flowchart
- Process Flowchart | Flow chart Example. Warehouse Flowchart ...
- Flowchart Marketing Process. Flowchart Examples | Flowchart ...
- How to Create a Social Media DFD Flowchart | Manage Social ...
- Sales Process Flowchart . Flowchart Examples | Marketing and Sales ...
- Flowchart on Bank. Flowchart Examples | Bank social media ...
- How to Create a Data Flow Diagram using ConceptDraw PRO | Data ...
- UML Use Case Diagram Example Social Networking Sites Project ...
- How to Connect Social Media DFD Flowchart with Action Maps ...
- Social strategy - Pyramid diagram | Online store social media ...
- How to Create a Social Media DFD Flowchart | Venn diagram ...
- Bank social media response flowchart | ConceptDraw PRO: Able to ...
- Social Media Response | How to Create a Social Media DFD ...
- How to Create a Social Media DFD Flowchart | Social Media ...
- How to Create a Social Media DFD Flowchart | Data Flow Diagrams ...
- Flowchart Social Media Activity
- Data Flow Diagram For A Social Network
- Data Flow Diagram For Online Social Network Creation
- Social Networking Flowchart