This site uses cookies. By continuing to browse the ConceptDraw site you are agreeing to our Use of Site Cookies.

Basic Flowchart Symbols and Meaning

Flowchart Symbols and Meaning - Provides a visual representation of basic flowchart symbols and their proposed use in professional workflow diagram, standard process flow diagram and communicating the structure of a well-developed web site, as well as their correlation in developing on-line instructional projects. See flowchart's symbols by specifics of process flow diagram symbols and workflow diagram symbols.
How to Build a Flowchart

Process Flowchart

ConceptDraw is Professional business process mapping software for making process flow diagram, workflow diagram, general flowcharts and technical illustrations for business documents. It is includes rich examples, templates, process flowchart symbols. ConceptDraw flowchart maker allows you to easier create a process flowchart. Use a variety of drawing tools, smart connectors, flowchart symbols and shape libraries to create flowcharts of complex processes, process flow diagrams, procedures and information exchange.
How To Create a Process Flow Chart (business process modelling techniques)

Types of Flowcharts

A Flowchart is a graphically representation of the process, algorithm or the step-by-step solution of the problem. There are ten types of Flowcharts. Using the Flowcharts solution from the Diagrams area of ConceptDraw Solution Park you can easy and quickly design the Flowchart of any of these types.
How to Simplify Flow Charting

Flowchart Programming Project. Flowchart Examples

Create you own flow charts of process-driven software applications using the ConceptDraw PRO diagramming and vector drawing software extended with the Cross-Functional Flowcharts solution from the Business Processes area of ConceptDraw Solution Park.
The programming project flow chart example shows the logical process of execution.

Best Vector Drawing Application for Mac OS X

ConceptDraw PRO creates drawings, diagrams and charts with great visual appeal in Mac OS X.

Types of Flowchart - Overview

When designing a process or an instruction in clear way, you should consider creating a flowchart. A Process Flow Diagram is the method. You can avoid wasting a lot of time understanding complex concepts as they get clear with different diagrams.
How to Simplify Flow Charting

Examples of Flowcharts, Org Charts and More

ConceptDraw examples covers a broad spectrum of business graphics categories. We separated all the graphic documents on application areas and had produced multiple solutions for each of them. ConceptDraw provides a wide variety of examples such as flowcharts, organizational charts, business charts, UML diagrams, database and ERD, directional map, network diagrams and lots more. Each solution accommodates 10+ examples that shows specific application cases of a diagram. ConceptDraw STORE is an application for downloading solutions with examples, templates and stencil libraries. Please choose any examples you are interested in, alternatively download them for free; you will need to install ConceptDraw to view them. As you will see, ConceptDraw is very powerful, you can use more than 10000 symbols, examples, and many pre-drawn templates, to create your own spectacular flowcharts, business diagrams, network diagrams and lots more, effortlessly, and in no time at all.
What is ConceptDraw OFFICE

Accounting Flowchart Symbols

The excellent possibility to create professional-looking Accounting Flowcharts is offered by powerful ConceptDraw PRO software and its Accounting Flowcharts solution. This solution contains wide variety of predesigned accounting flowchart symbols commonly used when representing the flow of data, documents, tasks and people responsible for performance each stage of accounting work process.

Venn Diagram Examples for Problem Solving. Computer Science. Chomsky Hierarchy

A Venn diagram, sometimes referred to as a set diagram, is a diagramming style used to show all the possible logical relations between a finite amount of sets. In mathematical terms, a set is a collection of distinct objects gathered together into a group, which can then itself be termed as a single object. Venn diagrams represent these objects on a page as circles or ellipses, and their placement in relation to each other describes the relationships between them.
The Venn diagram example below visualizes the the class of language inclusions described by the Chomsky hierarchy.

Account Flowchart. Flowchart Examples

Create your own flow charts of computer or network system account processing using the ConceptDraw PRO diagramming and vector drawing software extended with the Cross-Functional Flowcharts solution from the Business Processes area of ConceptDraw Solution Park.
The flow chart example shows the computer network system account processing.

Flow Chart Design - How to Design a Good Flowchart

Use ConceptDraw PRO business diagramming and business graphics software for general diagramming purposes, it inludes tousands colored professional flowchart symbols, examples and samples which saves time when you prepare documents, professional presentations or make an explanation of process flow diagram.

Cloud Computing Architecture Diagrams

For documenting the Cloud Computing Architecture with a goal to facilitate the communication between stakeholders are successfully used the Cloud Computing Architecture diagrams. It is convenient and easy to draw various Cloud Computing Architecture diagrams in ConceptDraw PRO software with help of tools of the Cloud Computing Diagrams Solution from the Computer and Networks Area of ConceptDraw Solution Park.
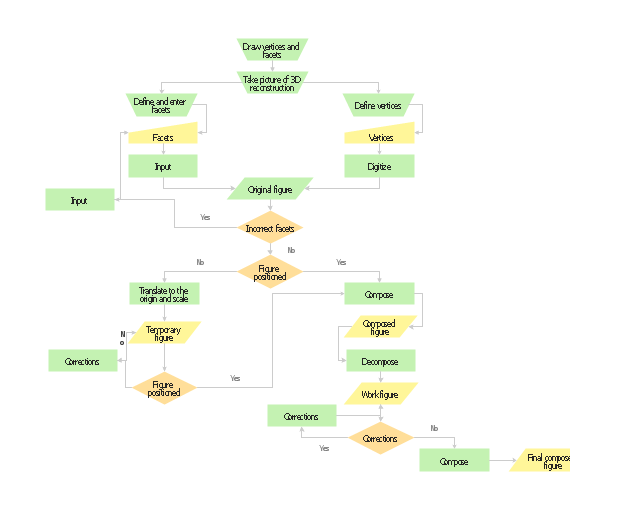
Planning scheme for the construction of a synthetic object.
"Computer-generated imagery (CGI) ... is the application of computer graphics to create or contribute to images in art, printed media, video games, films, television programs, commercials, and simulators. The visual scenes may be dynamic or static, and may be two-dimensional (2D), though the term "CGI" is most commonly used to refer to 3D computer graphics used for creating scenes or special effects in films and television." [Computer-generated imagery. Wikipedia]
The flow chart example "Synthetic object construction" was created using the ConceptDraw PRO diagramming and vector drawing software extended with the Flowcharts solution from the area "What is a Diagram" of ConceptDraw Solution Park.
Flowchart - Synthetic object construction
Flowchart - Synthetic object construction, process, manual operation, manual input, decision, data,
Used Solutions

How To Create a Flow Chart in ConceptDraw

ConceptDraw PRO is a flowchart creating software. This software includes over 20 vector stencils in libraries. These objects allow you to create well-designed flowcharts.
Put an initial object from library to a page and use RapidDraw technology clicking on direction arrows to add new objects to the flowchart. This way you can make flowchart quickly.