Accounts Payable Flowchart
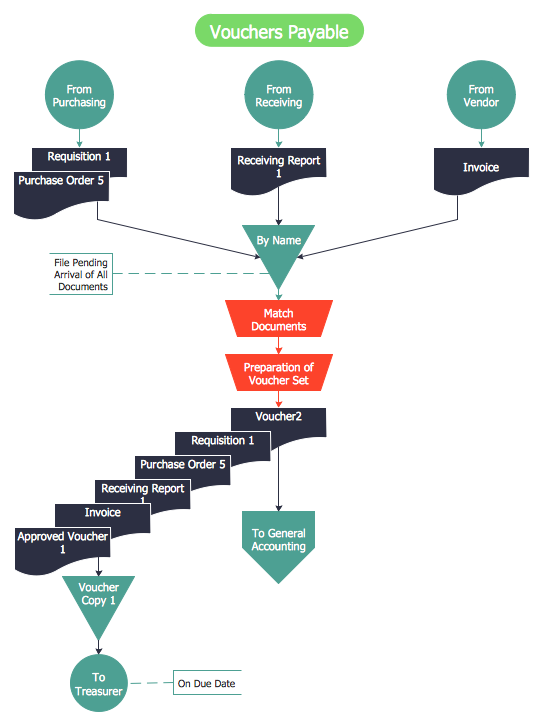
Accounts Payable Flowchart - There is nothing easier than do it in ConceptDraw PRO. ConceptDraw PRO diagramming and vector drawing software provides the Accounting Flowcharts Solution from the Finance and Accounting Area of ConceptDraw Solution Park. The Accounting Flowcharts Solution contains templates, samples and library of ready-to-use predesigned vector objects that will help you create: accounts payable flowchart, accounts payable process flow chart, accounting flowchart of any complexity quick and easy.Process Flowchart
The main reason of using Process Flowchart or PFD is to show relations between major parts of the system. Process Flowcharts are used in process engineering and chemical industry where there is a requirement of depicting relationships between major components only and not include minor parts. Process Flowcharts for single unit or multiple units differ in their structure and implementation. ConceptDraw PRO is Professional business process mapping software for making Process flowcharts, Process flow diagram, Workflow diagram, flowcharts and technical illustrations for business documents and also comprehensive visio for mac application. Easier define and document basic work and data flows, financial, production and quality management processes to increase efficiency of your business with ConcepDraw PRO. Business process mapping software with Flowchart Maker ConceptDraw PRO includes extensive drawing tools, rich examples and templates, process flowchart symbols and shape libraries, smart connectors that allow you create the flowcharts of complex processes, process flow diagrams, procedures and information exchange. Process Flowchart Solution is project management workflow tools which is part ConceptDraw Project marketing project management software. Drawing charts, diagrams, and network layouts has long been the monopoly of Microsoft Visio, making Mac users to struggle when needing such visio alternative like visio for mac, it requires only to view features, make a minor edit to, or print a diagram or chart. Thankfully to MS Visio alternative like ConceptDraw PRO software, this is cross-platform charting and business process management tool, now visio alternative for making sort of visio diagram is not a problem anymore however many people still name it business process visio tools.
Activity Network (PERT) Chart
Activity Network and Project Evaluation and Review Technique, or PERT, charts are a way of documenting and analyzing the tasks in a project. This diagram is constructed as part of the process in creating a schedule of corrective actions. The Activity Network Chart (PERT) shows the logical connections and consequence of tasks to be performed. It displays the time period for problem solving and the implementation of all activities through the critical path.Basic Flowchart Symbols and Meaning
Flowcharts are the best for visually representation the business processes and the flow of a custom-order process through various departments within an organization. ConceptDraw PRO diagramming and vector drawing software extended with Flowcharts solution offers the full set of predesigned basic flowchart symbols which are gathered at two libraries: Flowchart and Flowcharts Rapid Draw. Among them are: process, terminator, decision, data, document, display, manual loop, and many other specific symbols. The meaning for each symbol offered by ConceptDraw gives the presentation about their proposed use in professional Flowcharts for business and technical processes, software algorithms, well-developed structures of web sites, Workflow diagrams, Process flow diagram and correlation in developing on-line instructional projects or business process system. Use of ready flow chart symbols in diagrams is incredibly useful - you need simply drag desired from the libraries to your document and arrange them in required order. There are a few serious alternatives to Visio for Mac, one of them is ConceptDraw PRO. It is one of the main contender with the most similar features and capabilities.
Value Stream Mapping Symbols
VSM symbols are the best for a production process designing. The entire Value Stream Mapping method uses a graphical representation of the manufacturing process, factors' pros and cons, that all stakeholders can easily understand. Value Stream Mapping is a graphical technique that provides possibilities to improve analysis of a manufacturing process, at the stage of the transferring information or materials that required to deliver a product or service to the customer.Business diagrams & Org Charts with ConceptDraw PRO
The business diagrams are in great demand, they describe the business processes, business tasks and activities which are executed to achieve specific organizational and business goals, increase productivity, reduce costs and errors. They let research and better understand the business processes. ConceptDraw PRO is a powerful professional cross-platform business graphics and business flowcharting tool which contains hundreds of built-in collections of task-specific vector stencils and templates. They will help you to visualize and structure information, create various Business flowcharts, maps and diagrams with minimal efforts, and add them to your documents and presentations to make them successful. Among them are Data flow diagrams, Organization charts, Business process workflow diagrams, Audit flowcharts, Cause and Effect diagrams, IDEF business process diagrams, Cross-functional flowcharts, PERT charts, Timeline diagrams, Calendars, Marketing diagrams, Pyramids, Target diagrams, Venn diagrams, Comparison charts, Analysis charts, Dashboards, and many more. Being a cross-platform application, ConceptDraw PRO is very secure, handy, free of bloatware and one of the best alternatives to Visio for Mac users.
Critical Path Method in ConceptDraw PROJECT
The Critical Path Method (CPM) is an algorithm for scheduling a set of project activities. It is an important tool for effective project management. ConceptDraw PROJECT implements this method to provide the user with a wide set of project management tools.How to Draw a Good Diagram of a Business Workflow?
To draw a good diagram of a business workflow you should have a ready-to-use set of pre-designed objects you may drag-and-drop to your document focusing on the workflow structure and meaning, not drawing tools. ConceptDraw PRO with Workflow Diagrams solution provides complete set of design element you may use to draw a good diagram of a business workflow.Swim Lanes Flowchart. Flowchart Examples
This sample was created in ConceptDraw PRO diagramming and vector drawing software using the Cross-Functional Flowcharts solution from the Business Processes area of ConceptDraw Solution Park. This sample shows the Swim Lanes Flowchart of Identification and logging.
 Sales Dashboard
Sales Dashboard solution extends ConceptDraw PRO software with templates, samples and library of vector stencils for drawing the visual dashboards of sale metrics and key performance indicators (KPI).
Project — Working With Costs
ConceptDraw PROJECT delivers a rich set of built-in functionalities and optional product extensions that support your daily workflow in time-saving and creative ways. This video lesson will teach you how to work with costs in your project document.Flowchart Example: Flow Chart of Marketing Analysis
An example flowchart of marketing analysis shows main steps you have to challenge writing a marketing analysis.HelpDesk
How to Plan and Allocate Resources in Your Project with ConceptDraw PROJECT for Windows
Effective resource management is a key factor in the successful project implementation. The common types of resources for which the project manager has an impact, include material resources (materials, energy), staff (work) and equipment. CoceptDraw PROJECT provides easy ways to project Resources Management: Create a list of project resources and assign the right human resource, as well as the necessary material, or equipment to be used.Looking at ConceptDraw MINDMAP as a Replacement for Mindjet Mindmanager
The comparing of ConceptDraw MINDMAP to Mindjet Mindmanager allows to identify a lot of benefits. At first, the ConceptDraw MINDMAP has a lower price, the flexible licensing, the license is per-named-user, no charge for major product upgrades and no charge for support. ConceptDraw MINDMAP is effective for launching the stalled projects to new heights, it possess the excellent possibility of importing and exporting to other mind mapping program file formats. ConceptDraw MINDMAP easily integrates with wide set of programs, among them Evernote, Skype, Twitter, Microsoft Word, Microsoft PowerPoint, Microsoft Project, Mindjet Mindmanager, ConceptDraw PROJECT, ConceptDraw PRO, with solutions from ConceptDraw Solution Park. Now you have a freedom to choose the best format for each your document, it is incredibly easy to make the Skype presentation, to take and share critical information, to send your Mind Map to Evernote, to import / export MS Word documents, MS PowerPoint presentations, the project data, open and save Mindmanager files, to map out the long-term Twitter messages and publish them to your Twitter account directly from a Mind Map.HelpDesk
What Information to be Displayed in the ConceptDraw PROJECT Gantt Chart View
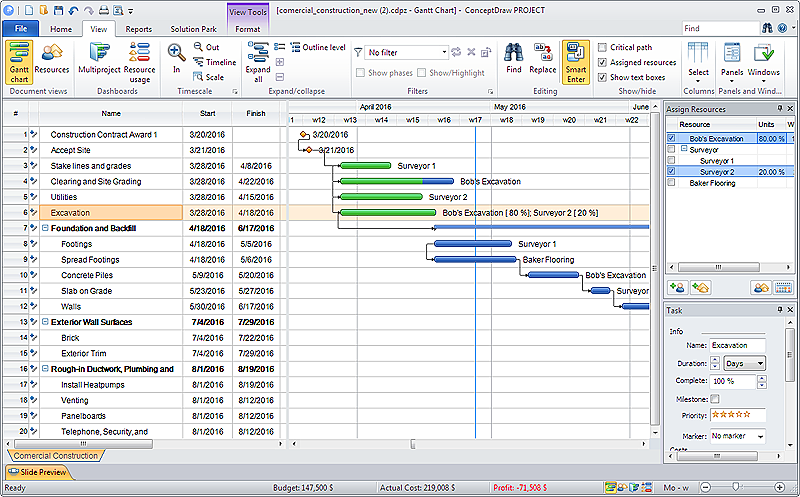
What information can can contain the project task list? Gantt Chart view is a graphical representation of a project outline that allows one to allocate tasks.You can customize a project’s tasks list view to include the columns you need to meet your information requirements. The columns of the ConceptDraw PROJECT Gantt view contain the information you want to capture about each task in your project. The following article details what information can be contained in the columns of a project outline:<
- Sales Process Flowchart . Flowchart Examples | Process Flowchart ...
- Sales Process Flowchart . Flowchart Examples | Structured Systems ...
- Sales Process Flowchart . Flowchart Examples | Structured Systems ...
- Process Flowchart | Sales department - Vector stencils library | Sales ...
- UML Diagram | Sales Process Flowchart . Flowchart Examples | Flow ...
- Flowchart Software | Marketing and Sales Organization chart ...
- Process Flowchart | Sales Process Flowchart . Flowchart Examples ...
- Flowchart of Products. Flowchart Examples | Sales Process ...
- Process Flowchart | Sales Process Flowchart . Flowchart Examples ...
- Material Requisition Flowchart . Flowchart Examples | Purchasing ...
- Sales Process Flowchart . Flowchart Examples | Account Flowchart ...
- Flowchart Symbols Accounting. Activity-based costing (ABC ...
- Flowchart Marketing Process. Flowchart Examples | Flowchart ...
- Process Flowchart | Basic Flowchart Symbols and Meaning ...
- Sales Process Flowchart . Flowchart Examples | Sales Process ...
- Workflow to Make a Purchase. Accounting Flowchart Example ...
- Sales Process Flowchart . Flowchart Examples | Flow chart Example ...
- Flowchart Symbols Accounting. Activity-based costing (ABC ...
- Process Flowchart | Copying Service Process Flowchart . Flowchart ...
- Process Flowchart | How to Create a Social Media DFD Flowchart ...


