Account Flowchart. Flowchart Examples

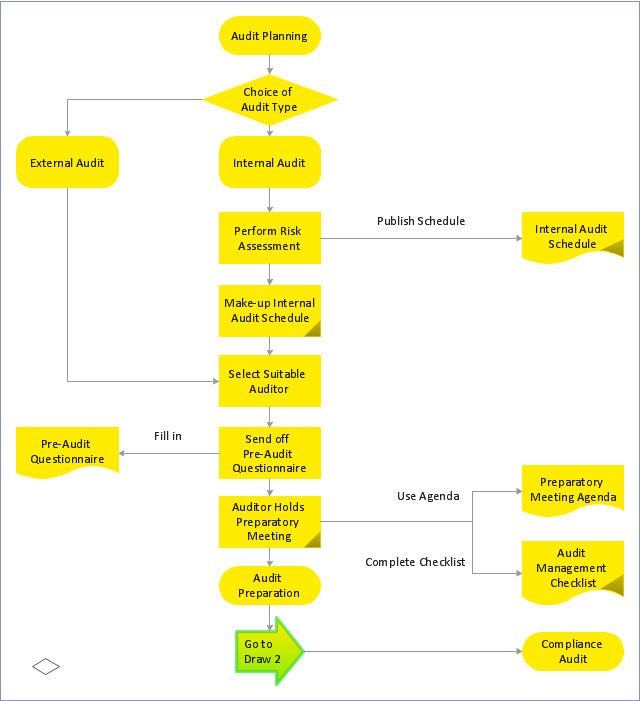
"Audit planning is a vital area of the audit primarily conducted at the beginning of audit process to ensure that appropriate attention is devoted to important areas, potential problems are promptly identified, work is completed expeditiously and work is properly coordinated. "Audit planning" means developing a general strategy and a detailed approach for the expected nature, timing and extent of the audit. The auditor plans to perform the audit in an efficient and timely manner. ...
An Audit plan is the specific guideline to be followed when conducting an audit. It helps the auditor obtain sufficient appropriate evidence for the circumstances, helps keep audit costs at a reasonable level, and helps avoid misunderstandings with the client.
It addresses the specifics of what, where, who, when and how:
What are the audit objectives?
Where will the audit be done? (i.e. scope)
When will the audit(s) occur? (how long?)
Who are the auditors?
How will the audit be done?" [Audit plan. Wikipedia]
The audit planning flowchart example was created using the ConceptDraw PRO diagramming and vector drawing software extended with the Audit Flowcharts solution from the Finance and Accounting area of ConceptDraw Solution Park.
www.conceptdraw.com/ solution-park/ finance-audit-flowcharts
Flowchart 1
Flowchart 2
The vector stencils library "Process flowchart" contains 9 flow chart symbols.
Use it to design your process flowcharts with ConceptDraw PRO diagramming and vector drawing software.
"A flowchart is a type of diagram that represents an algorithm, workflow or process, showing the steps as boxes of various kinds, and their order by connecting them with arrows. ...
Kaoru Ishikawa defined the flowchart as one of the seven basic tools of quality control, next to the histogram, Pareto chart, check sheet, control chart, cause-and-effect diagram, and the scatter diagram. ...
Common alternative names include: flowchart, process flowchart, functional flowchart, process map, process chart, functional process chart, business process model, process model, process flow diagram, work flow diagram, business flow diagram. The terms "flowchart" and "flow chart" are used interchangeably." [Flowchart. Wikipedia]
The example of flow chart symbols "Design elements - Process flowchart" is included in the Seven Basic Tools of Quality solution from the Quality area of ConceptDraw Solution Park.
Process flowchart symbols

"In elementary algebra, a quadratic equation (from the Latin quadratus for "square") is any equation having the form
ax^2+bx+c=0
where x represents an unknown, and a, b, and c are constants with a not equal to 0. If a = 0, then the equation is linear, not quadratic. The constants a, b, and c are called, respectively, the quadratic coefficient, the linear coefficient and the constant or free term.
Because the quadratic equation involves only one unknown, it is called "univariate". The quadratic equation only contains powers of x that are non-negative integers, and therefore it is a polynomial equation, and in particular it is a second degree polynomial equation since the greatest power is two.
Quadratic equations can be solved by a process known in American English as factoring and in other varieties of English as factorising, by completing the square, by using the quadratic formula, or by graphing." [Quadratic equation. Wikipedia]
The flowchart example "Solving quadratic equation algorithm" was created using the ConceptDraw PRO diagramming and vector drawing software extended with the Mathematics solution from the Science and Education area of ConceptDraw Solution Park.
Solving quadratic equation flow chart

Diagram Flow Chart

Settlement Process Flowchart. Flowchart Examples

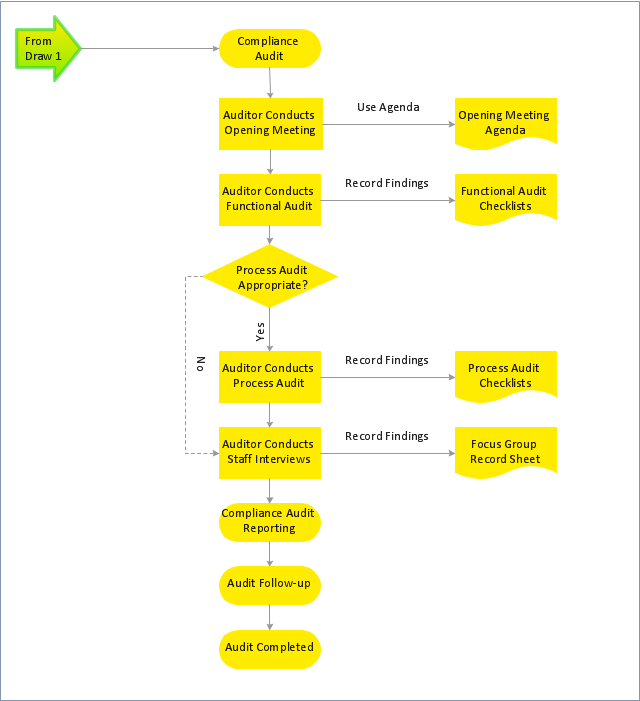
"The general definition of an audit is a planned and documented activity performed by qualified personnel to determine by investigation, examination, or evaluation of objective evidence, the adequacy and compliance with established procedures, or applicable documents, and the effectiveness of implementation. The term may refer to audits in accounting, internal controls, quality management, project management, water management, and energy conservation.
Auditing is defined as a systematic and independent examination of data, statements, records, operations and performances (financial or otherwise) of an enterprise for a stated purpose. In any auditing the auditor perceives and recognizes the propositions before him for examination, collects evidence, evaluates the same and on this basis formulates his judgment which is communicated through his audit report. The purpose is then to give an opinion on the adequacy of controls (financial and otherwise) within an environment they audit, to evaluate and improve the effectiveness of risk management, control, and governance processes." [Audit. Wikipedia]
The audit flowchart example "Audit process flowchart" was created using the ConceptDraw PRO diagramming and vector drawing software extended with the Audit Flowcharts solution from the Finance and Accounting area of ConceptDraw Solution Park.
Audit Process Flowchart
.png--diagram-flowchart-example.png)
Section 1
.png--diagram-flowchart-example.png)
Section 2
.png--diagram-flowchart-example.png)
The vector stencils library "Audit flowcharts" contains 31 symbols of audit flow chart diagrams for accounting, financial management, fiscal information tracking, money management, decision flowcharts, and financial inventories.
"A financial audit, or more accurately, an audit of financial statements, is the verification of the financial statements of a legal entity, with a view to express an audit opinion. The audit opinion is intended to provide reasonable assurance, but not absolute assurance, that the financial statements are presented fairly, in all material respects, and/ or give a true and fair view in accordance with the financial reporting framework. The purpose of an audit is to provide an objective independent examination of the financial statements, which increases the value and credibility of the financial statements produced by management, thus increase user confidence in the financial statement, reduce investor risk and consequently reduce the cost of capital of the preparer of the financial statements. ...
Financial audits are typically performed by firms of practicing accountants who are experts in financial reporting. The financial audit is one of many assurance functions provided by accounting firms. Many organizations separately employ or hire internal auditors, who do not attest to financial reports but focus mainly on the internal controls of the organization. External auditors may choose to place limited reliance on the work of internal auditors. Auditing promotes transparency and accuracy in the financial disclosures made by an organization, therefore would likely to reduce of such corporations to conceal unscrupulous dealings.
Internationally, the International Standards on Auditing (ISA) issued by the International Auditing and Assurance Standards Board (IAASB) is considered as the benchmark for audit process. Almost all jurisdictions require auditors to follow the ISA or a local variation of the ISA." [Financial audit. Wikipedia]
The example "Design elements - Audit flowchart" was created using the ConceptDraw PRO diagramming and vector drawing software extended with the Audit Flowcharts solution from the Finance and Accounting area of ConceptDraw Solution Park.
Audit flowchart symbols

The vector stencils library "Flowchart" contains 26 symbols for drawing the flow charts using the ConceptDraw PRO diagramming and vector drawing software.
"Flowcharts are used in designing and documenting complex processes or programs. Like other types of diagrams, they help visualize what is going on and thereby help the viewer to understand a process, and perhaps also find flaws, bottlenecks, and other less-obvious features within it. There are many different types of flowcharts, and each type has its own repertoire of boxes and notational conventions. The two most common types of boxes in a flowchart are:
(1) a processing step, usually called activity, and denoted as a rectangular box;
(2) a decision, usually denoted as a diamond.
A flowchart is described as "cross-functional" when the page is divided into different swimlanes describing the control of different organizational units. A symbol appearing in a particular "lane" is within the control of that organizational unit. This technique allows the author to locate the responsibility for performing an action or making a decision correctly, showing the responsibility of each organizational unit for different parts of a single process. ...
Common alternate names include: flowchart, process flowchart, functional flowchart, process map, process chart, functional process chart, business process model, process model, process flow diagram, work flow diagram, business flow diagram. The terms "flowchart" and "flow chart" are used interchangeably." [Flowchart. Wikipedia]
The example "Design elements - Flowchart" is included in the Flowcharts solution from the area "What is a Diagram" of ConceptDraw Solution Park.
Flowchart notation

"Project planning is part of project management, which relates to the use of schedules such as Gantt charts to plan and subsequently report progress within the project environment.
Initially, the project scope is defined and the appropriate methods for completing the project are determined. Following this step, the durations for the various tasks necessary to complete the work are listed and grouped into a work breakdown structure. Project planning is often used to organize different areas of a project, including project plans, work loads and the management of teams and individuals. The logical dependencies between tasks are defined using an activity network diagram that enables identification of the critical path. Float or slack time in the schedule can be calculated using project management software. Then the necessary resources can be estimated and costs for each activity can be allocated to each resource, giving the total project cost. At this stage, the project schedule may be optimized to achieve the appropriate balance between resource usage and project duration to comply with the project objectives. Once established and agreed, the project schedule becomes what is known as the baseline schedule. Progress will be measured against the baseline schedule throughout the life of the project. Analyzing progress compared to the baseline schedule is known as earned value management.
The inputs of the project planning phase include the project charter and the concept proposal. The outputs of the project planning phase include the project requirements, the project schedule, and the project management plan." [Project planning. Wikipedia]
The flow chart example "Project planning process" was created using the ConceptDraw PRO diagramming and vector drawing software extended with the Flowcharts solution from the area "What is a Diagram" of ConceptDraw Solution Park.
Flowchart - Project planning process

- Prepare A Flowchart To Show How Wikipedia Is Created
- Flowchart To Show How Wikipedia Is Created
- Flowchart Symbols And Meanings In Wikipedia
- Flow Chart To Show How Wikipedia Is Created
- Design elements - Process flowchart | Design elements - Sales ...
- Wikipedia Flowchart
- Cross Functional Flowchart Wikipedia
- Design elements - Process flowchart | Design elements - Flowchart ...
- Draw Dfd Diagram Level 0 And 1 Wikipedia